


2026 Cotality Wildfire Risk Report
Marcus and Chloe knew enough to be cautious. The couple bought a home in a dense suburban neighborhood in Colorado, deliberately choosing a lot two miles from the wildland-urban interface (WUI) and the forested foothills beyond it.
They were semi-aware of the evolving wildfire threat, and more importantly, they understood the reality of the modern insurance market: coverage can be hard to find, harder to keep, and premiums are climbing year over year. To protect their investment and maintain their insurability, they took proactive steps. They diligently cleared dry brush from their yard and removed debris, earning a property-level mitigation discount from their insurer.
They were confident they had done everything right. However, they hadn't realized the importance of adequate Reconstruction Cost Valuation (RCV). Years of compounding construction inflation, combined with post-disaster demand surge, had created a gap between their policy limits and the real-world cost of recovery.
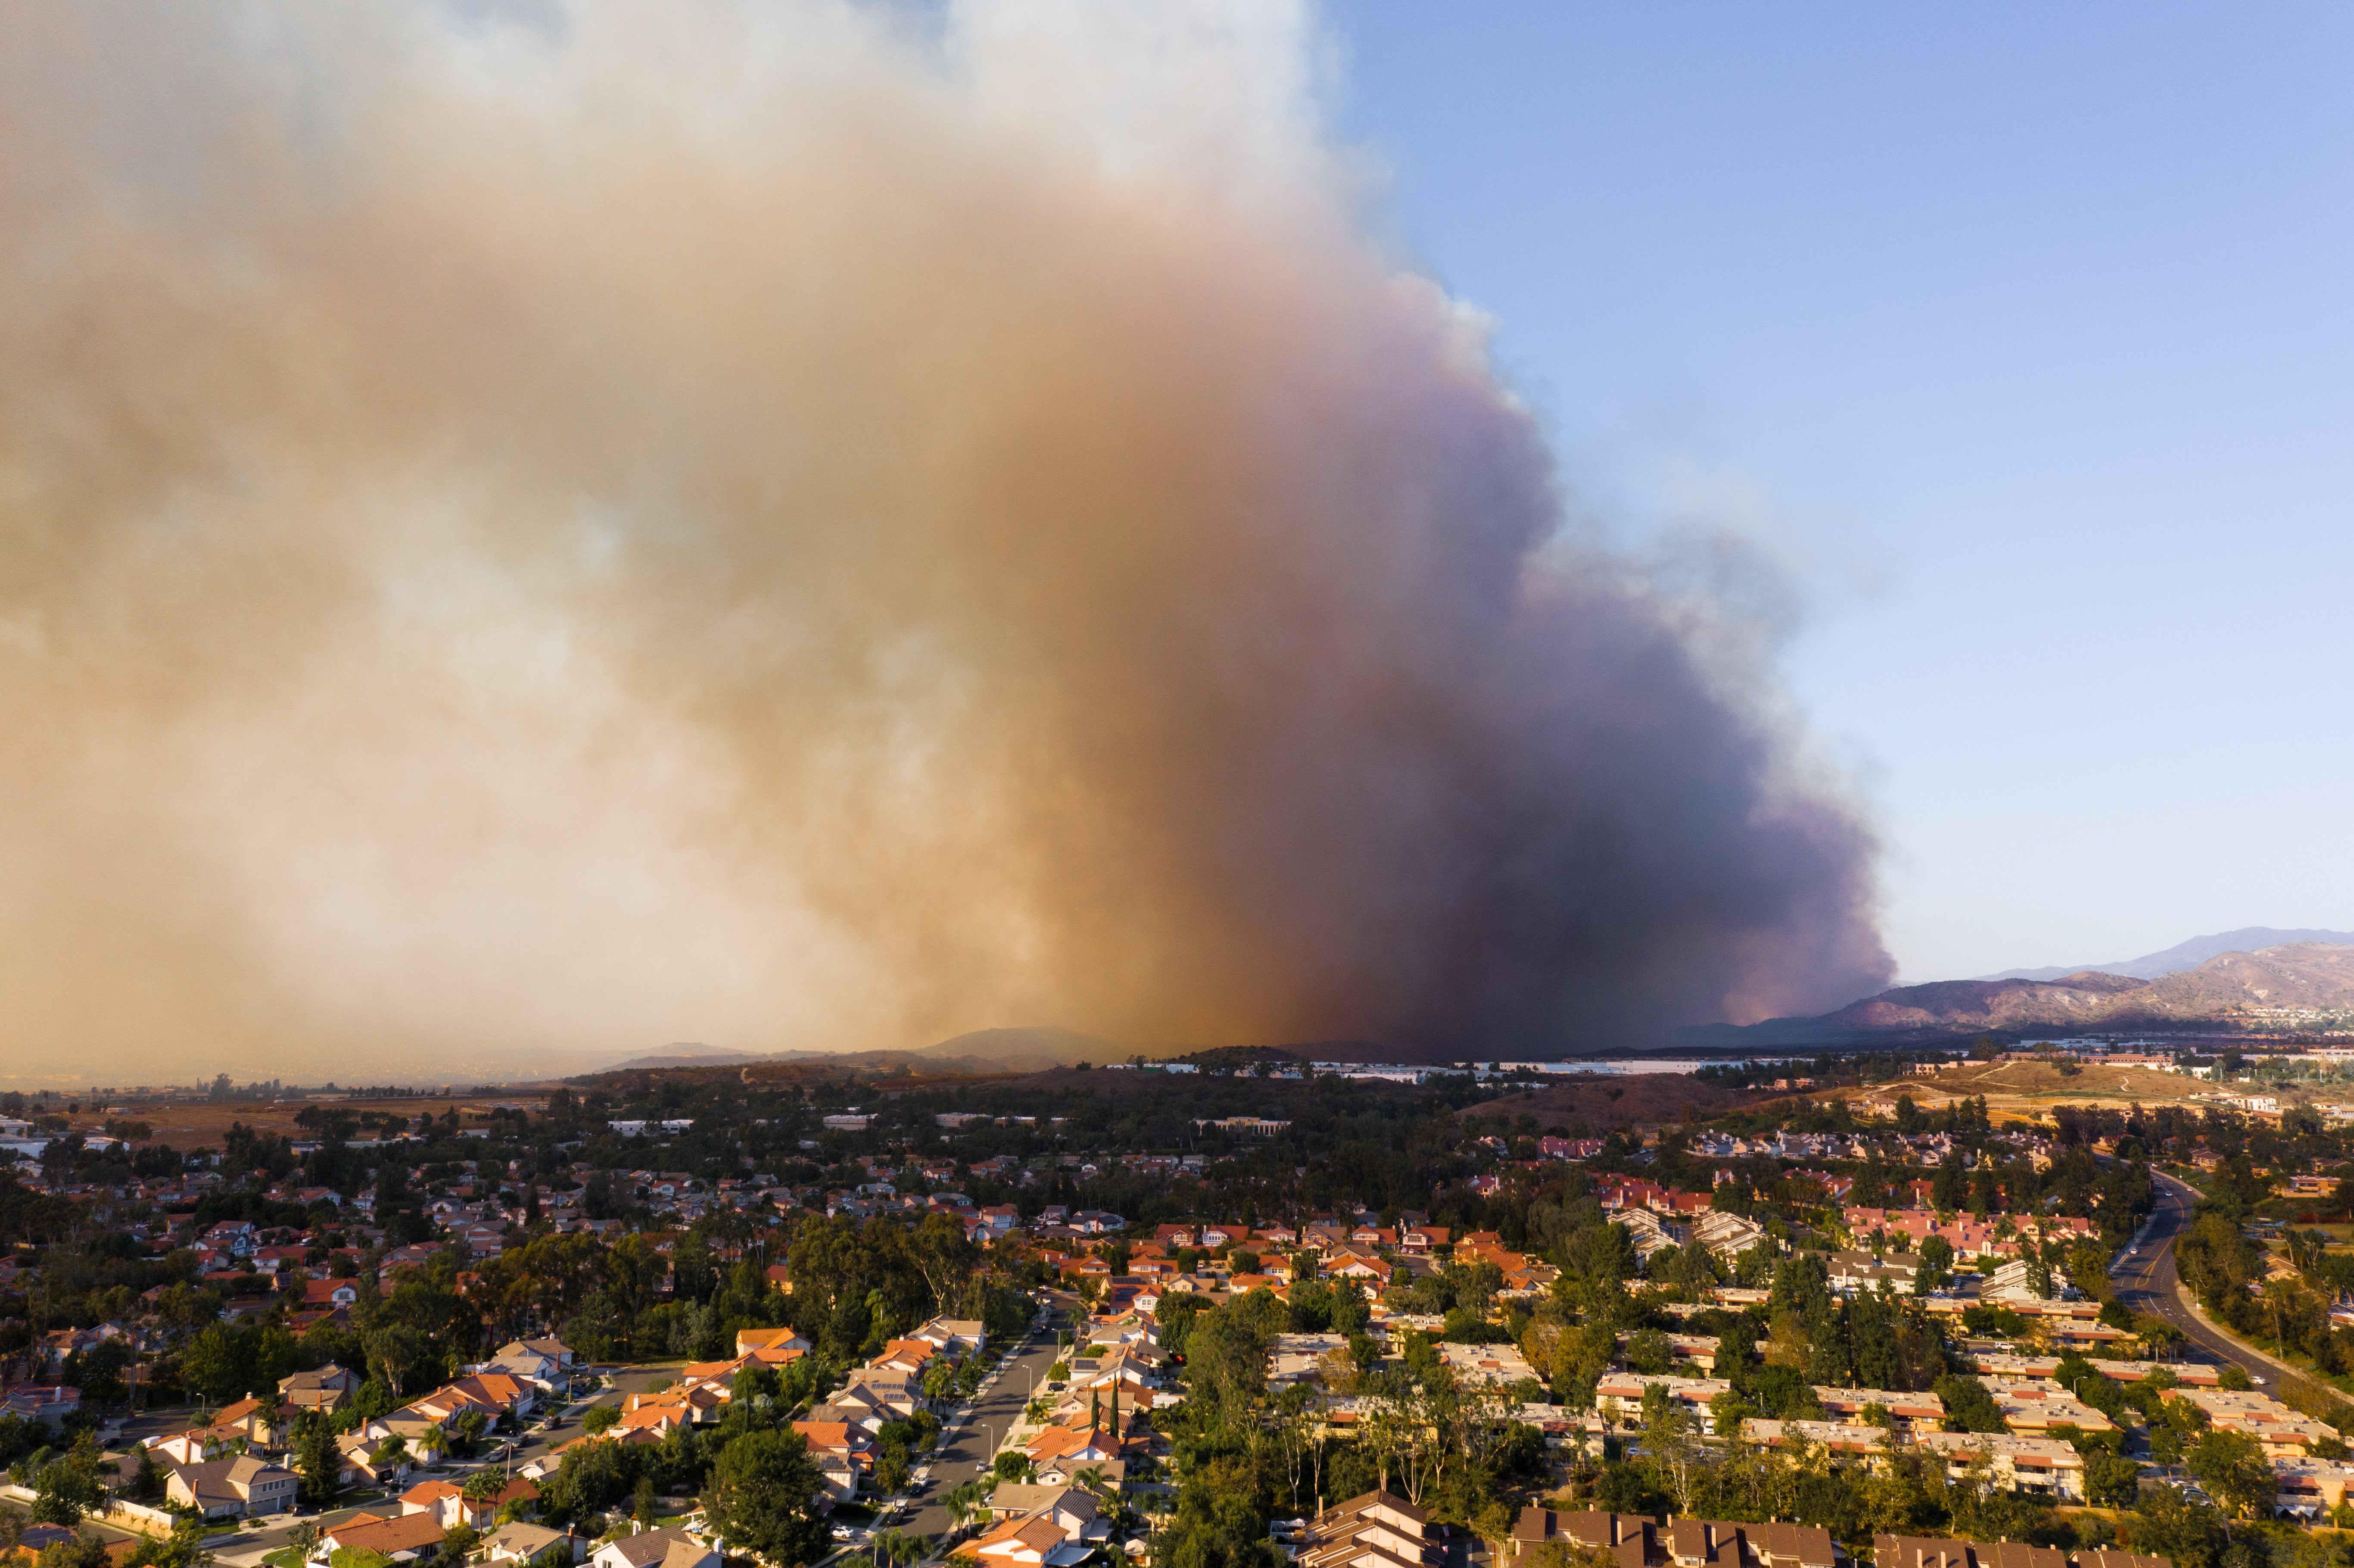
Then a severe drought arrived, and a brushfire ignited miles away. Driven by 60 mph winds, embers flew over the two-mile buffer that had made the couple feel safe. Like many others, their understanding of wildfire risk assumed that danger stopped where the forest ended, failing to recognize that once a fire enters a suburban neighborhood, the homes themselves become the fuel.
While Marcus and Chloe had diligently maintained their defensible space, their neighbors hadn't understood the critical threat of unmitigated spaces. An ember caught a highly flammable wood fence next door; the fence lit the house behind it, escalating a distant wildfire into an urban conflagration moving structure to structure.
The couple lost their home—and discovered a six-figure shortfall between their insurance payout and the true cost to rebuild in a post-disaster market.
This story of a fictional couple plays out in real communities as wildfire seasons expand. Four systemic failures transform localized wildfire risk into a compounding industry crisis:
- The assessment gap — how physical risk is modeled in the built environment
- The incentive gap — how property-level mitigation is rewarded, and where it fails without community-wide adoption
- The protection gap — how shrinking insurance availability, combined with coverage limits that lag with real-world reconstruction costs, leaves policyholders severely exposed
- The temporal gap — how dynamic landscape changes are tracked over time

Assessment gap
The hidden danger of conflagration
Traditional wildfire models generalize hazard from natural vegetation and terrain, giving properties the highest risk score where fuels are dense and slopes are steep, then stepping risk down as development thickens. That logic holds until fire reaches the built environment, where legacy models alone fall short, with the result being a risk mis-assessment.
When flames move from wildland fuels into a neighborhood, the fire changes character. Structures become the dominant fuel source, turning the event into a wind-driven conflagration. Homes rated low hazard by vegetation-focused models sit directly in the path of this threat, and even a perfectly hardened home remains exposed when surrounded by flammable construction.
Cotality Wildfire Risk Score near Colorado Springs, Colorado

Data source: Cotality proprietary data, 2026
Cotality modeling reveals the scale of this blind spot: layering conflagration potential onto a traditional wildfire risk score can add as many as 40 points to a property's risk score, pushing meaningful hazard risk deep into neighborhoods legacy maps labeled as low risk.
Point increase from the Wildfire Risk Score when conflagration is included near Colorado Springs, Colorado

Data source: Cotality proprietary data, 2026
Closing the assessment gap requires high-definition models that evaluate structure density, building characteristics, wind patterns, and ember influence alongside terrain and natural fuels.
Carriers that account for these structure-to-structure externalities upfront can ensure properties are adequately insured against neighborhood-driven catastrophes rather than just forest fires alone.
Accurate assessment is the foundation for every defense that follows, because a risk that is never seen can never be assessed, mitigated, or disclosed.
Incentive gap
Rewarding property-level mitigation
The scientific consensus on structure survival is clear: outcomes are determined largely within the Home Ignition Zone (HIZ)—the building itself and the immediate 100-foot perimeter.
While homeowners can harden these zones today, an incentive gap persists because insurers have historically lacked the property-level data required to grant verified premium credits. The result is a damaging cycle. Without financial reward or awareness of the risk, homeowners invest little in mitigation, risk stays elevated, carriers retreat, and policies pour into overburdened state residual markets.
Address-specific analytics break this loop.
A property-level mitigation score (scaled 0.1 to 100) combining community protections, parcel conditions, and structural hardening provides underwriters a defensible basis for pricing. Two high-leverage signals carry the strongest weight:
- Noncombustible zone 0: Maintaining a 0- to 5-foot ember-resistant perimeter around the foundation
- Class A roof verification: Ensuring top-tier fire resistance where ember accumulation is highest
The actuarial proof is definitive. A Cotality analysis of 6.8 million single-family residences—using a mitigation scoring methodology approved for insurance rating use in California— demonstrates that modeled loss costs fall exponentially as mitigation improves.
California homes ranked by mitigation quality
Homes in the top 10% for mitigation carry expected losses roughly 78% below the statewide average, while the bottom 10% run more than 10 times the average, about $47 in expected loss for every $1 on the best-prepared homes.
Regulatory frameworks are shifting to reflect these economics. California's Safer from Wildfires regulation requires premium discounts for verified mitigation. Meanwhile, Colorado's House Bill 25-1182 goes further, requiring carriers using wildfire risk scores to disclose them, credit parcel- and community-level mitigation, and provide homeowners a formal channel to appeal incorrect scores or uncredited property improvements.
Protection gap
Aligning coverage limits with real-world recovery costs
As wildfire risk escalates, a massive protection gap is widening. Shrinking insurance availability, combined with coverage limits that lag real-world reconstruction costs, leaves policyholders severely exposed.
When valuations remain static, policyholders fall victim to a silent exposure: years of compounding construction inflation and post-disaster "demand surge." Because modern WUI wildfires frequently cause total losses, this lag creates severe out-of-pocket shortfalls during reconstruction. Unfunded recovery costs trigger mortgage delinquencies, erode community resilience, and introduce systemic risk into the broader housing finance system.
To close this gap, the industry must move beyond static valuations. To close this gap, the industry must move beyond static valuations. Dynamic RCV intelligence that tracks labor and material costs keeps coverage limits aligned with true rebuilding costs, while probabilistic catastrophe models translate physical risk into expected annual dollar losses before policies are written. Together, these capabilities protect both the policyholder and portfolio solvency.
Temporal gap
Preburn and postburn risk
Even accurate, mitigation-aware risk assessment can drift out of date, because wildfire fuel is dynamic. Preventing sudden premium shocks requires holding two concurrent views of the same property:
- Preburn risk (long-term horizon): Reflects baseline hazard conditions before recent fires. Because natural vegetation regenerates quickly, pricing solely on the temporarily low risk following a burn creates false security and severe downstream rate shocks
- Postburn risk (immediate horizon): Captures real-time exposure by factoring in active burn scars—providing the precise, current reading for immediate underwriting decisions
To quantify this exposure, Cotality conducted a parcel-level analysis identifying U.S. properties with a postburn wildfire risk score of 51 or higher (the threshold for moderate or greater risk).
Across the 10 most exposed states, there are more than 2.5 million properties carrying a moderate or greater risk of wildfire. Those properties have a combined RCV approaching $1.4 trillion.
Top 10 states for number of properties with moderate or greater wildfire risk
Data source: Cotality proprietary data, 2026
Cotality Wildfire Risk Score in the United States

Data source: Cotality proprietary data, 2026
Cotality Wildfire Risk Score in California

Data source: Cotality proprietary data, 2026
Cotality Wildfire Risk Score in Texas

Data source: Cotality proprietary data, 2026
Cotality Wildfire Risk Score in Colorado

Data source: Cotality proprietary data, 2026
Metropolitan patterns mirror state rankings. California claims six of the 10 most exposed Core-Based Statistical Areas (CBSAs), led by Los Angeles, where nearly 250,000 at-risk properties represent more than $209 billion in RCV. Austin, Texas anchors the largest concentration outside California.
Top 10 metropolitan areas for number of properties with moderate or greater wildfire risk
Data source: Cotality proprietary data, 2026
Cotality Wildfire Risk Score in Los Angeles, California

Data source: Cotality proprietary data, 2026
Cotality Wildfire Risk Score in Austin, Texas

Data source: Cotality proprietary data, 2026
Cotality Wildfire Risk Score in Denver, Colorado

Data source: Cotality proprietary data, 2026
The year ahead illustrates why both horizons matter. Seasonal forecasts indicate 2026 may bring one of the strongest El Niño events in modern history. Cotality scientists expect the cycle to redistribute wildfire risk rather than retire it. Conditions in the Southwest should ease once winter precipitation arrives, while the Pacific Northwest dries into conditions associated with larger, more extreme fires.
By pairing real-time postburn exposure with long-term preburn trends, carriers avoid risk assessment surprises as natural fuels regenerate.
.png)
An international lens for a global crisis
These systemic gaps extend beyond North America. Extreme global wildfire activity over the past decade shows that as fire behavior intensifies, wind-driven embers can breach traditional boundaries and carry the threat deep into populated environments:
- Australia (Black Summer 2019–2020): An estimated 35.8 million hectares burned, destroying over 3,000 homes
- Greece (August 2021): The country's worst heatwave since 1987 drove fires through 125,000 hectares of forest and farmland, destroying dozens of homes and forcing the evacuation of villages and towns
- Canada (Jasper Wildfire, July 2024): Swept into Jasper, Alberta, destroying 358 structures containing an estimated 806 residential units and generating an estimated C$1.23 billion in insured losses
The 2026 season has carried that warning into the present. A stormy, unusually wet winter soaked much of Europe, and the saturated landscape answered with a surge of new vegetation. When record heat set in, that lush growth cured into a continent-wide bed of fine fuel. By late July, fires burning across Spain, France, and Italy had strained containment resources and forced the evacuation of hundreds of thousands of residents, with successive heatwaves arriving faster than crews could regain control. The season's full toll is still being written, but the sequence that produced it is already clear.
"Europe's 2026 fire season is climate whiplash in action," said Cotality Chief Scientist Howard Botts. "The same storms that soaked the continent in winter grew the fuel that is burning now. When conditions swing this quickly, static assumptions fail, and resilience depends on understanding what is at stake property by property, before the heat arrives."
The lesson repeats in every geography: treating wildfire purely as a wildland peril leaves communities and property portfolios deeply exposed. To maintain solvency in an era of intensifying fire behavior, the global insurance industry must look beyond traditional geographic boundaries and shift its focus toward understanding localized property-level vulnerability and the physics of ember transport.
A unified defense for property resilience
The combination of declining housing affordability and tightening insurance capacity demonstrates that legacy risk assumptions are no longer viable. Marcus and Chloe’s story illustrates how individual property owners—and the financial institutions backing them—can fall through all four gaps simultaneously.
A modern, unified defense requires four synchronized solutions:
- Integrating structure-to-structure conflagration metrics to close the assessment gap
- Providing scientifically backed mitigation credits to eliminate the incentive gap
- Analyzing preburn trends alongside postburn conditions to bridge the temporal gap
- Quantifying expected dollar losses upfront to stabilize insurance availability and close the protection gap
Transitioning to this high-definition approach does more than avert catastrophic losses; it creates room to grow. Carriers can confidently underwrite well-mitigated properties in markets where competitors have imposed blanket moratoriums, allocate capital more efficiently, and settle claims faster because properties were valued accurately at inception. For lenders, the same upfront transparency safeguards mortgage portfolios against underinsurance-driven defaults.
And for the homeowners themselves, this shift from broad regional assumptions to granular, property-level analytics is the key to lasting security. It ensures that local recovery networks are fully funded to rebuild, and that the next homebuyers two miles from the wildland fringe receive the security they paid for.
Close the gaps before the next fire season
Wildfire and conflagration risk can be assessed and mitigated at the property level. Explore the Cotality Wildfire Risk Suite to see how high-definition analytics can protect your portfolio and your policyholders.
© 2026 Cotality. All rights reserved. While all of the content and information is believed to be accurate, the content and information is provided by Cotality “as is” for informational and educational purposes only with no guarantee, representation, or warranty, express or implied, of any kind including but not limited to as to the merchantability, non-infringement of intellectual property rights, completeness, accuracy, applicability, or fitness, in connection with the content or information or product and Cotality assumes no responsibility or liability whatsoever for the content or information or product or any reliance thereon. Cotality™, the Cotality logo, and Intelligence beyond bounds™ are the trademarks of CoreLogic, Inc. d/b/a Cotality or its affiliates or subsidiaries. All other trademarks are the property of their respective owners.

