


Press Release
US homeowners reach a historic wealth plateau


IRVINE, Calif., July 23, 2026 — Homeowners’ wealth is on a solid foundation, with net equity for mortgages reaching $17.9 trillion in the first quarter of 2026, according to Cotality’s Homeowner Equity Insights Report.
Most American homeowners now have a comfortable equity cushion. Across 56.7 million U.S. properties, the average borrower has $310,500 in home equity.
Golden handcuffs trap
When the total equity pool is divided by the nation's 57.6 million mortgaged properties reveals that the average mortgaged homeowner holds an equity nest egg of $310,500.
Most of this wealth is tied up in their homes, and homeowners generally have two main ways to use it:
Borrowing against home equity: Homeowners can use options such as a home equity loan or line of credit to access some of their built-up wealth without giving up their current mortgage.
- Rising equity accumulation allowed homeowners to increasingly tap into that stored wealth. The first quarter 2026 saw a 10% quarter-over-quarter increase in U.S. homeowners (those with and without a mortgage) tapping into their wealth, with the quarterly figure for home equity lines of credit or home equity loans jumping to a little over $77.1 billion from $69.7 billion in the first quarter of 2025. Still, that’s only 0.2% of the total estimated homeowner equity of $34 trillion.
Selling and moving: Homeowners can sell their current home and use the equity to buy in another market, where that money may go further.
"American homeowners with a mortgage now hold nearly $17.9 trillion in home equity — about five times more than 15 years ago, when many started rebuilding after the Great Financial Crisis," said Selma Hepp, Cotality’s Chief Economist. "This large store of housing wealth continues to support household net worth, but it also keeps many homeowners handcuffed and contributes to a slower-moving housing market. At the same time, that equity provides an important financial cushion as everyday costs continue to rise."
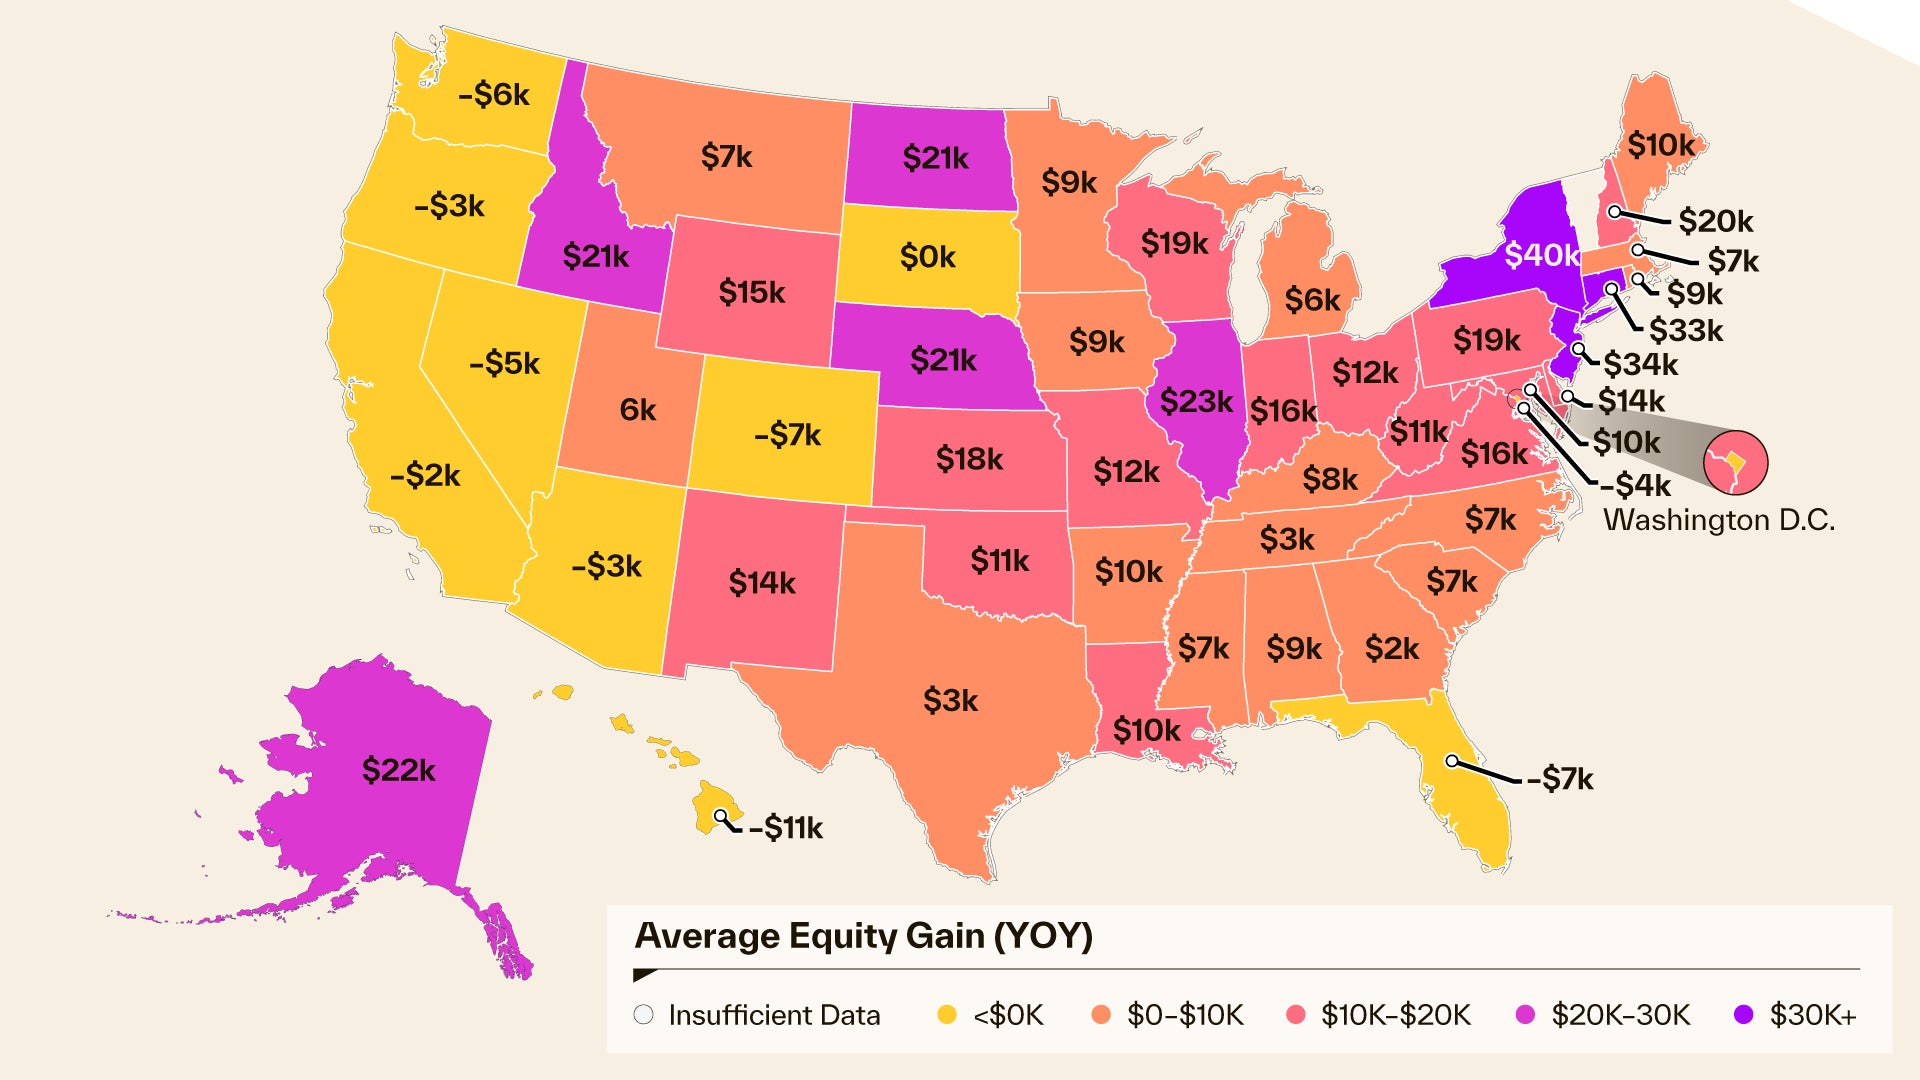
Equity performance split deepens regionally
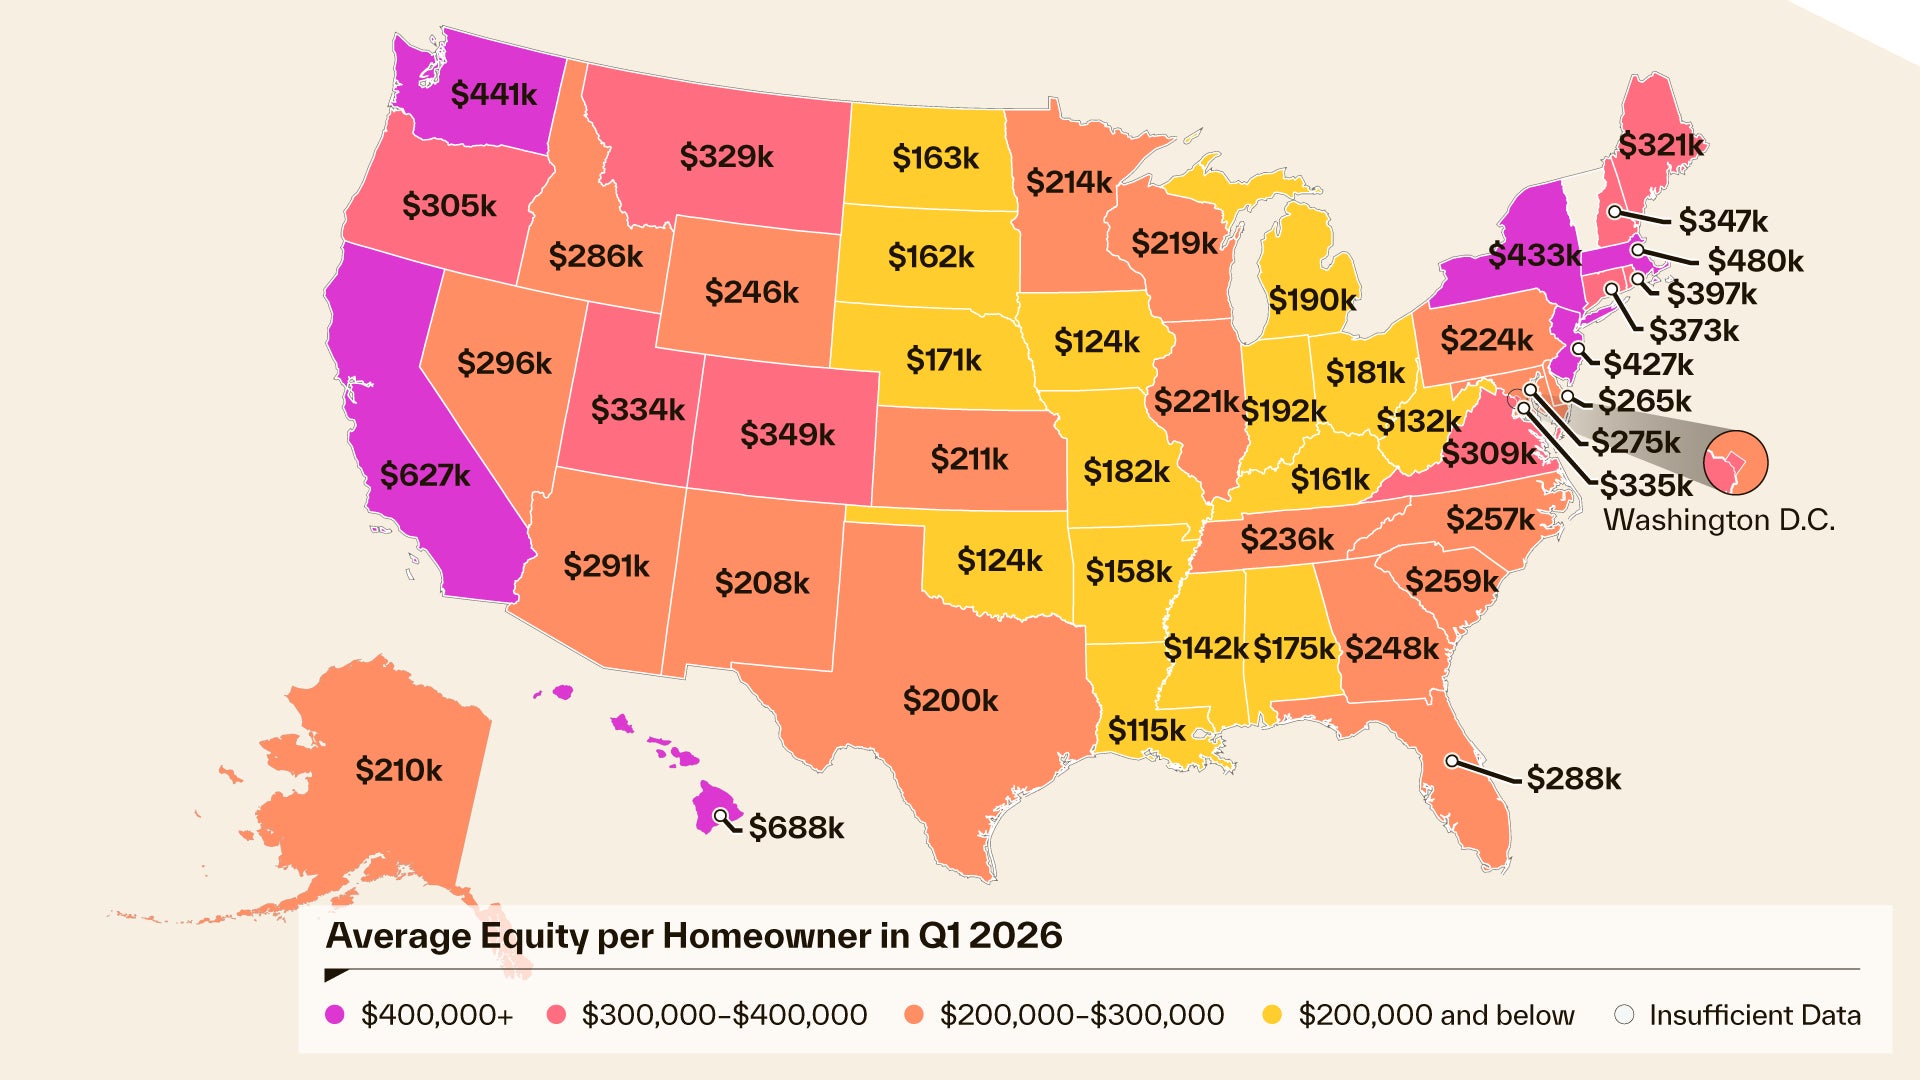
- Homeowner equity is divided across state lines. Homeowners in the West and Northeast hold the largest amounts of equity. In Hawaii, average equity per borrower is $688,000, followed by California ($626,900), Massachusetts ($479,600), Washington ($441,000), and New York ($433,000).
- States with the least amount of equity: Borrowers in Louisiana ($114,700), Oklahoma ($123,900), and Iowa ($124,300) have more limited funds locked up in their homes.
The California cash-out
The average mortgaged borrower in California currently holds a massive $626,900 in home equity — a figure that sits high above the national median home price of $342,200, giving California homeowners an equity buffer that is mathematically large enough to purchase a median-priced home entirely in cash in 48 out of 50 states.
When Cotality cross-referenced state-level equity data against current state median home prices, the potential purchasing power of California homeowners becomes highly significant:
- The Florida comparison: A California borrower's average equity could fund the purchase of a median-priced home in Florida ($355,000) entirely in cash, leaving an unspent equity cash reserve of $271,900.
- The Texas comparison: Comparing California equity against the Texas median home price ($308,500) yields a debt-free purchase with $319,400 remaining from the initial equity value.
- The Ohio comparison: In highly affordable markets like Ohio, where the median home price stands at $215,800, the average California equity position is worth nearly three times the cost of a local home, allowing for an all-cash purchase with $412,100 left over.
This mathematical reality demonstrates that for households willing to relocate, accumulated home equity can act as a functional escape hatch from elevated borrowing costs, allowing them to bypass the mortgage system entirely during a subsequent home purchase.
Negative equity becomes a near-obsolete concern
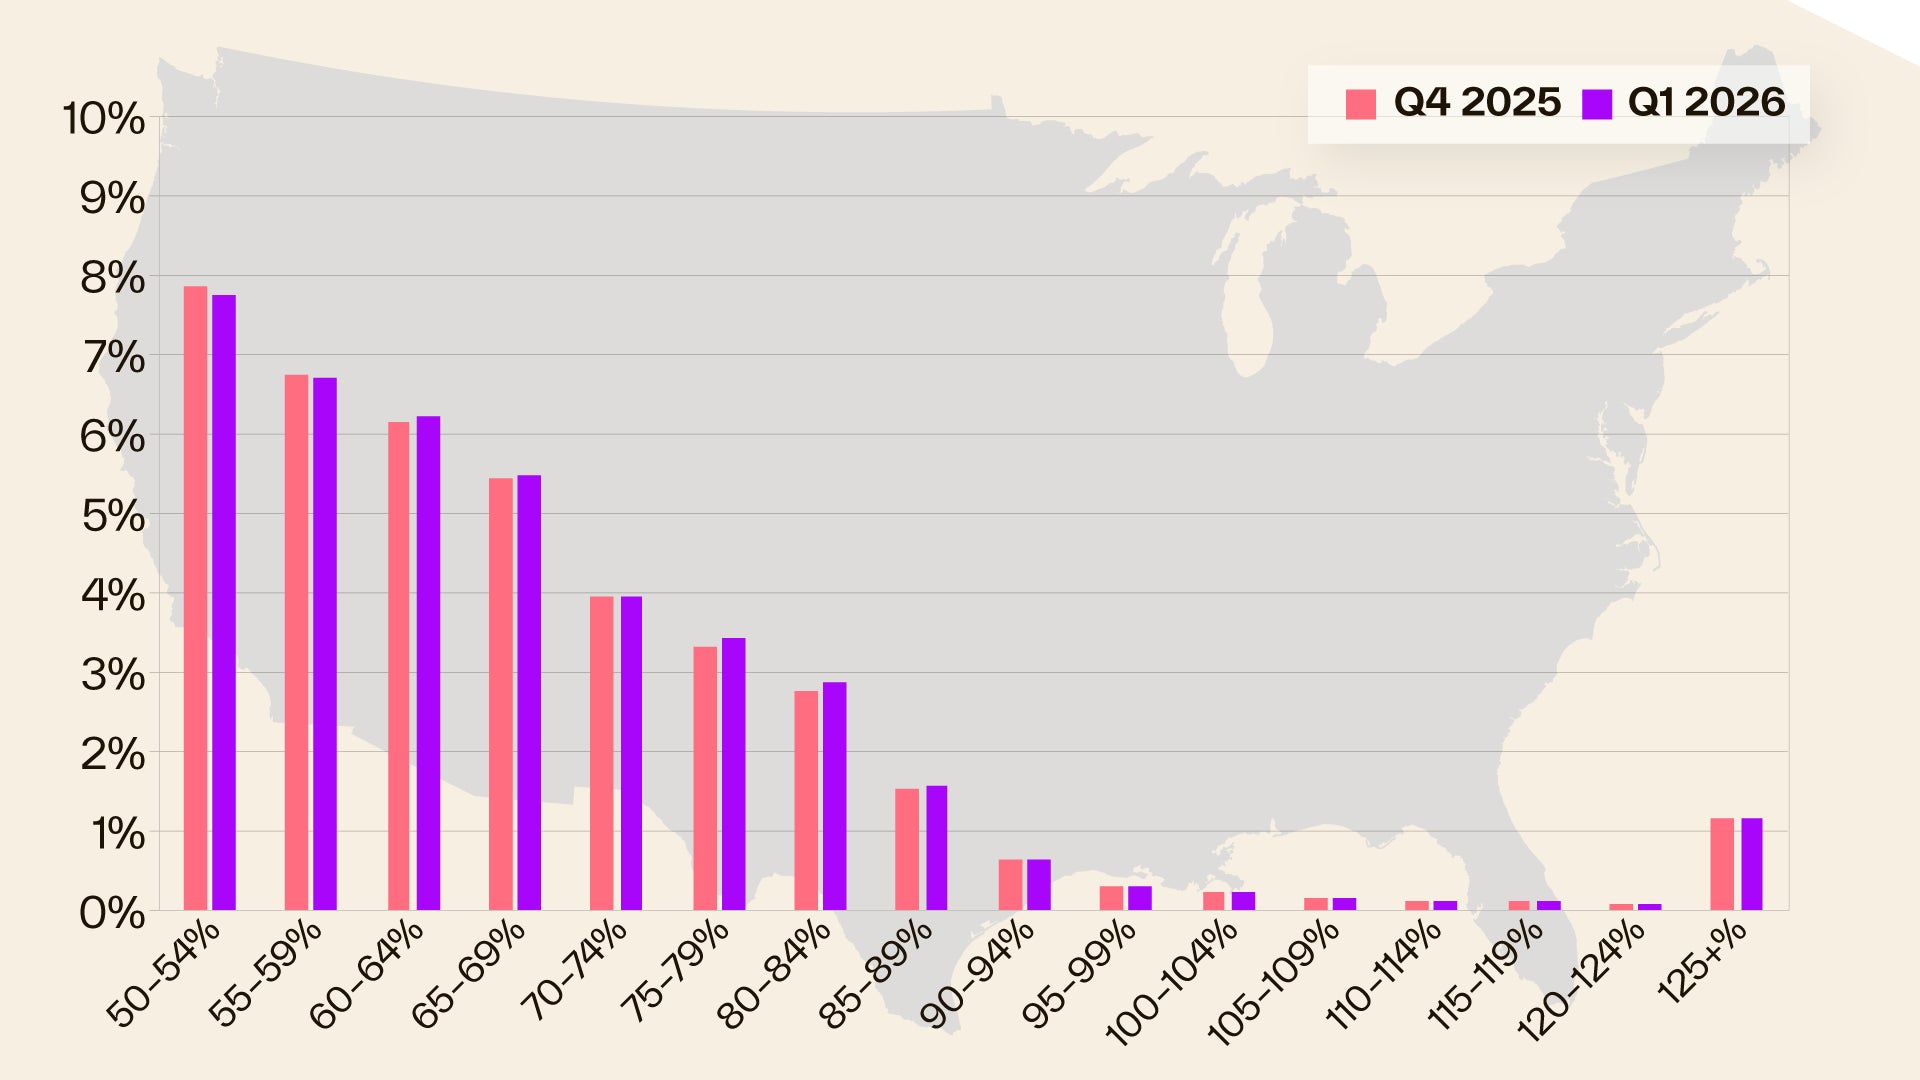
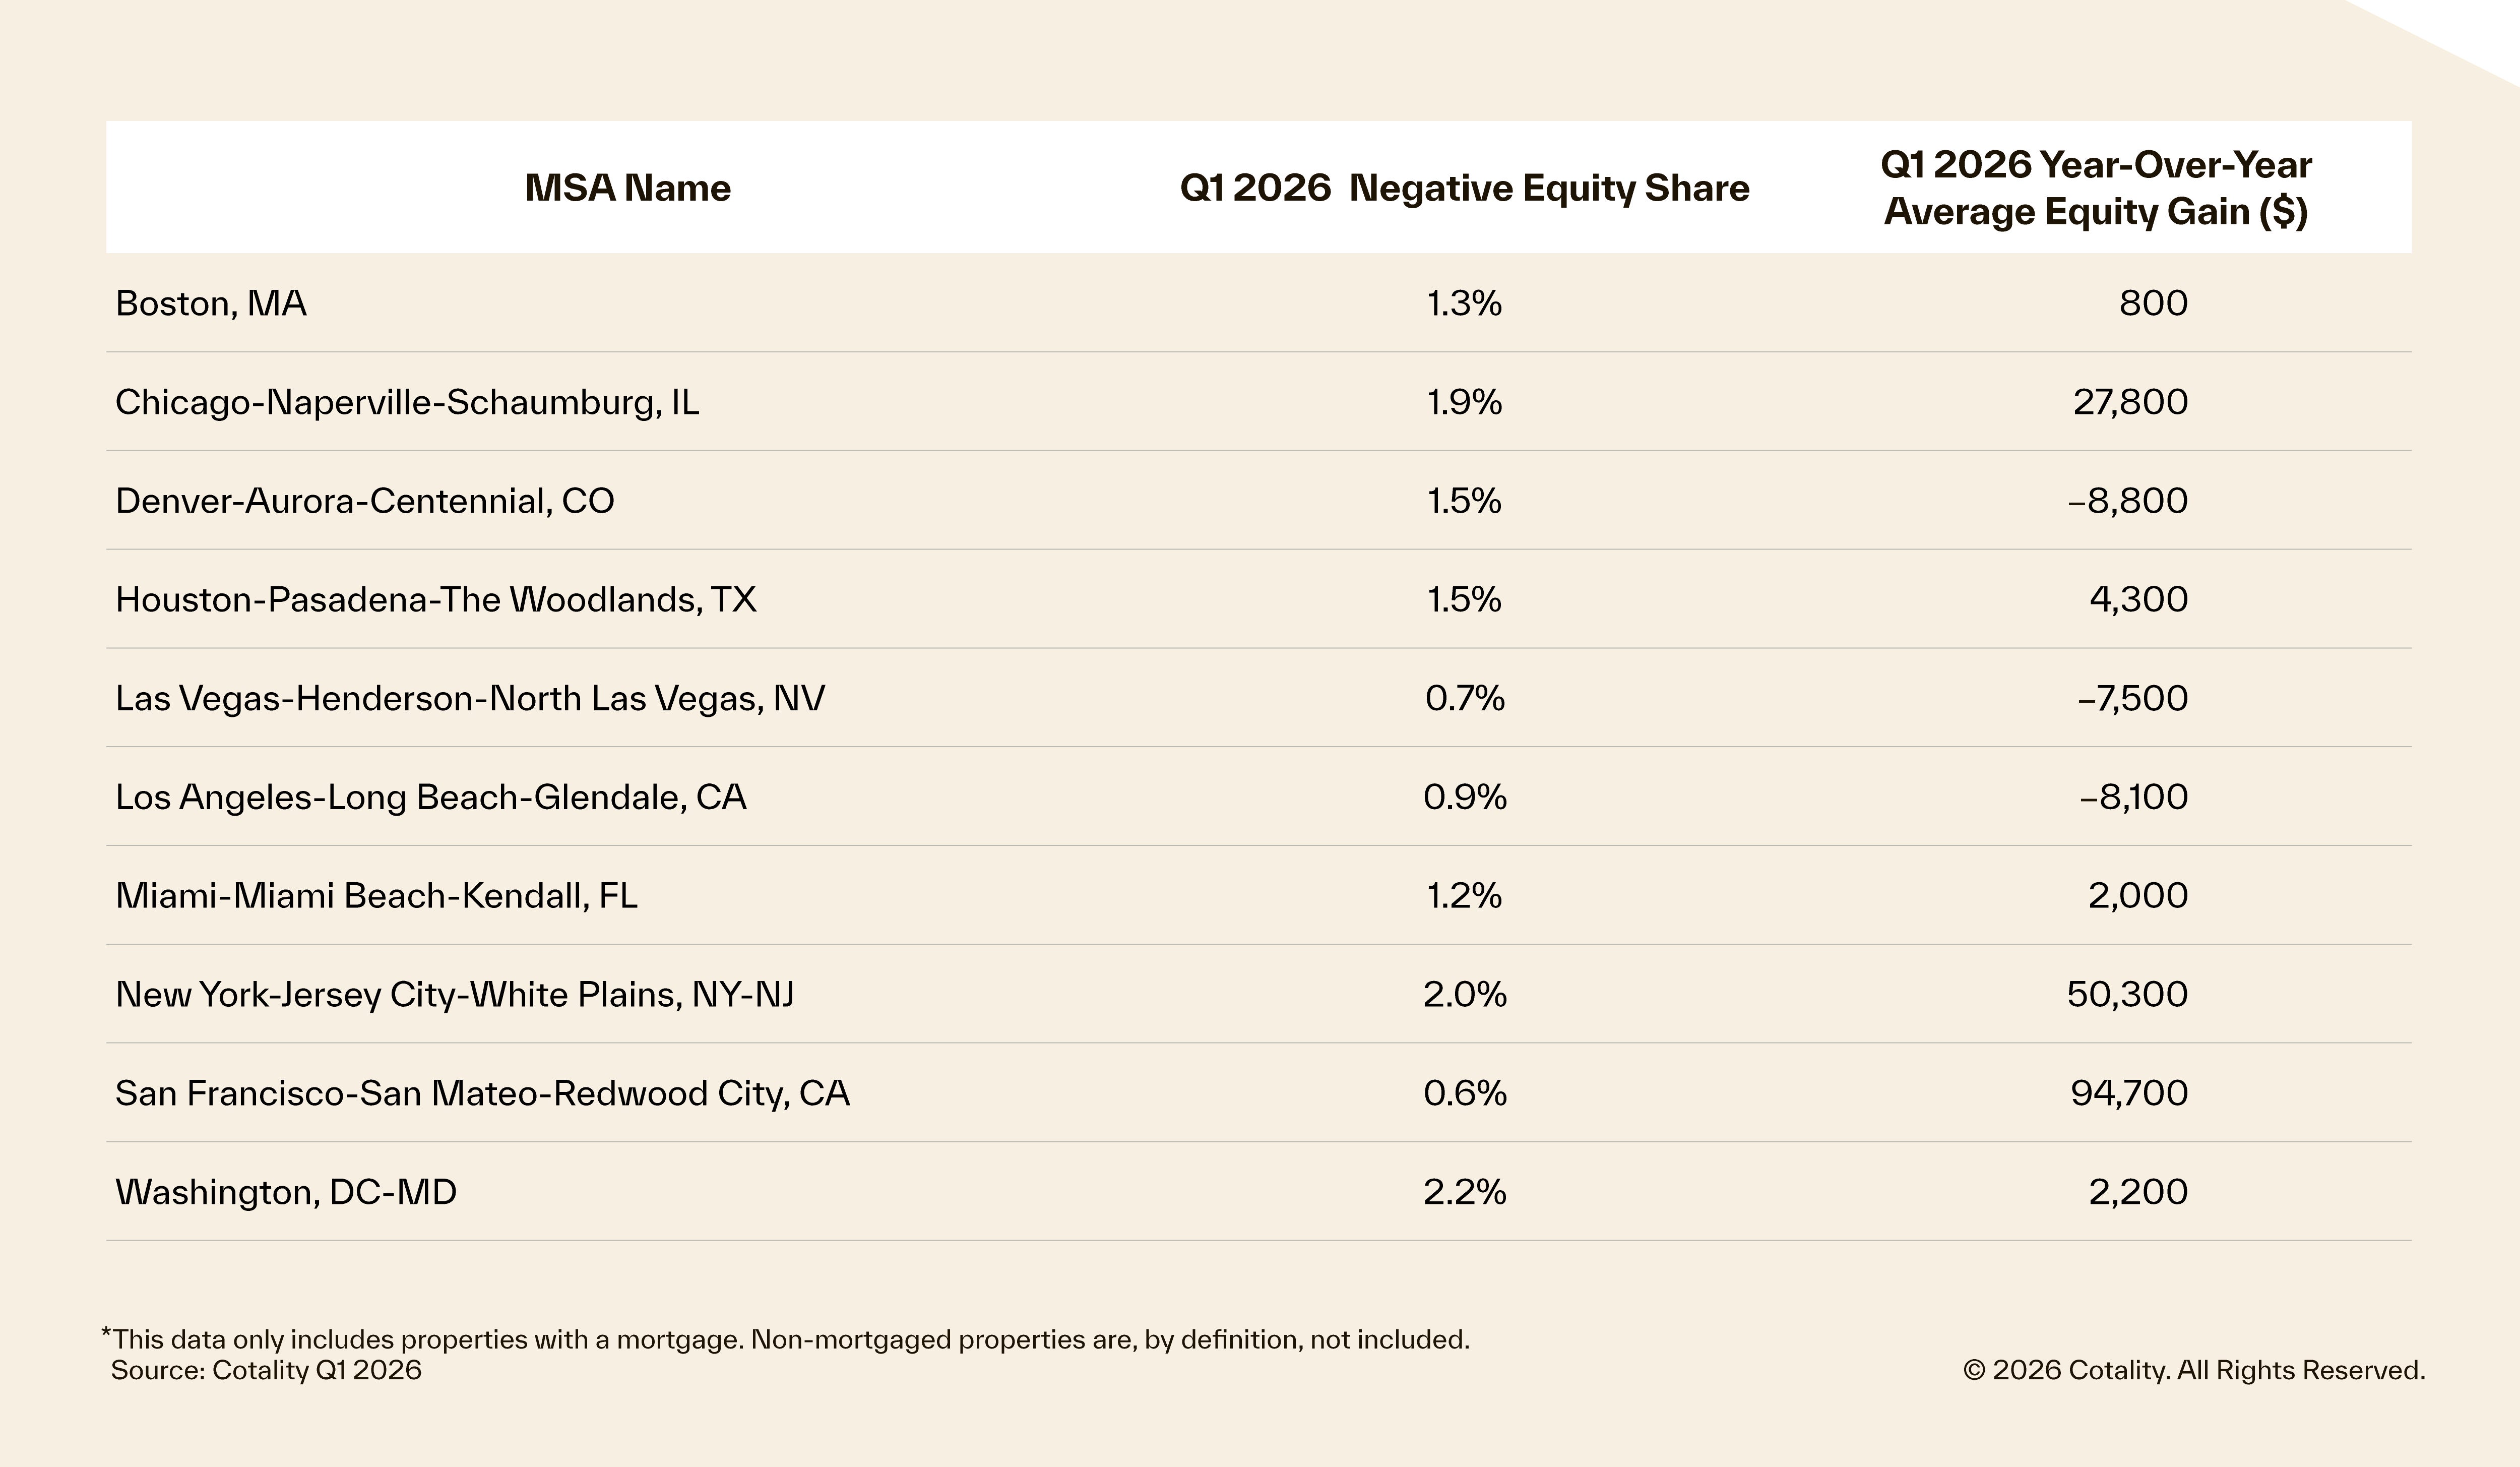
The risk of negative home equity has receded into background. The total number of underwater properties fell by 9% year-over-year (an absolute reduction of 106,000 homes).
Currently, only 1.9% of all mortgaged properties (approximately 1.09 million homes) remain in a negative equity position. For context, negative equity peaked at a staggering 26% of mortgaged properties in Q4 2009.
Cotality's sensitivity analysis highlights the deep resilience of the current mortgage pool: a further 5% rise in home prices would lift another 130,000 properties into positive equity, while an unexpected 5% market drop would only transition a modest 188,000 properties below the line.
Methodology
The amount of equity for each property is determined by comparing the estimated current value of the property against the mortgage debt outstanding (MDO). If the MDO is greater than the estimated value, then the property is determined to be in a negative equity position. If the estimated value is greater than the MDO, then the property is determined to be in a positive equity position. The data is first generated at the property level and aggregated to higher levels of geography. Cotality uses public record data as the source of the MDO, which includes more than 50 million first- and second mortgage liens and is adjusted for amortization and home equity utilization in order to capture the true level of MDO for each property. Only data for mortgaged residential properties that have a current estimated value are included. There are several states or jurisdictions where the public record, current value or mortgage data coverage is thin and have been excluded from the analysis. These instances account for fewer than 5% of the total U.S. population. The percentage of homeowners with a mortgage is from the 2019 American Community Survey. Data for the previous quarter was revised. Revisions with public records data are standard, and to ensure accuracy, Cotality incorporates the newly released public data to provide updated results.
Source: Cotality
The data provided is for use only by the primary recipient or the primary recipient’s publication or broadcast. This data may not be resold, republished, or licensed to any other source, including publications and sources owned by the primary recipient’s parent company, without prior written permission from Cotality. Any Cotality data used for publication or broadcast, in whole or in part, must be sourced as coming from Cotality, a data and analytics company. For use with broadcast or web content, the citation must directly accompany the first reference of the data. If the data is illustrated with maps, charts, graphs, or other visual elements, the Cotality logo must be included on screen or website. For questions, analysis, or interpretation of the data, contact newsmedia@cotality.com. Data provided may not be modified without the prior written permission of Cotality. Do not use the data in any unlawful manner.
About Cotality
Cotality accelerates data, insights, and workflows across the property ecosystem to enable industry professionals to surpass their ambitions and impact society. With billions of data signals across the life cycle of a property, we unearth hidden risks and transformative opportunities for agents, lenders, carriers, and innovators. Get to know us at cotality.com.
Media Contacts
Charity Head
