


As more wildfires cause total property loss, contractor shortages and soaring rebuild costs collide with underinsurance, slowing recovery and putting mortgages at risk.
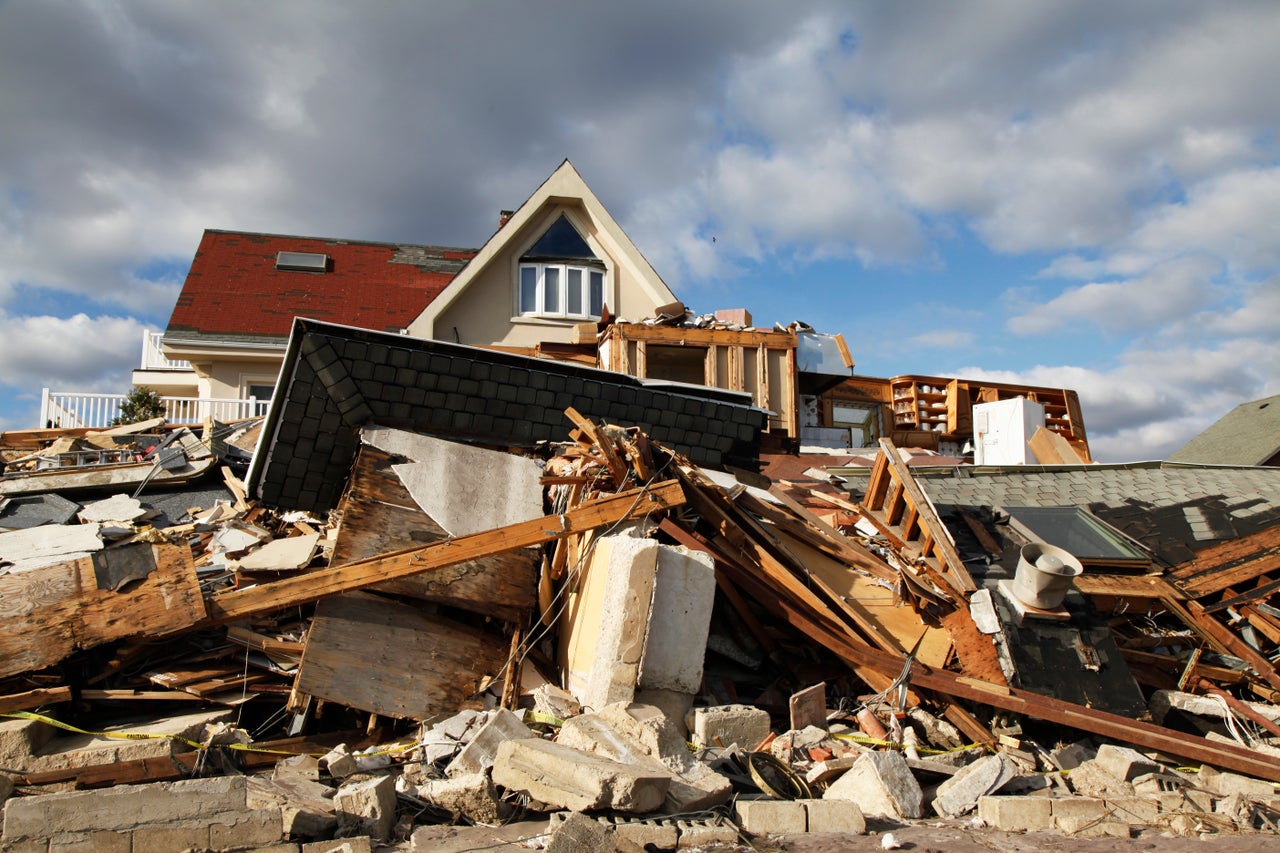
- Total loss: Wildfires often leave nothing behind, and scarce labor, inflated material costs, and under-sized payouts turn reconstruction efforts into a multi-year struggle.
- The underinsurance shock: Average dwelling limits can lag true reconstruction costs by six figures or more.
- Mortgage domino effect: Force-placed coverage and payment spikes push wildfire-damaged loans toward delinquency.
- Coverage crunch: Major carriers exiting Wildland-Urban Interface (WUI) ZIP codes leave over 452,000 California homes on the Fair Access to Insurance Requirements (FAIR) Plan and counting, and there are similar inflows into other state safety-net plans looming.

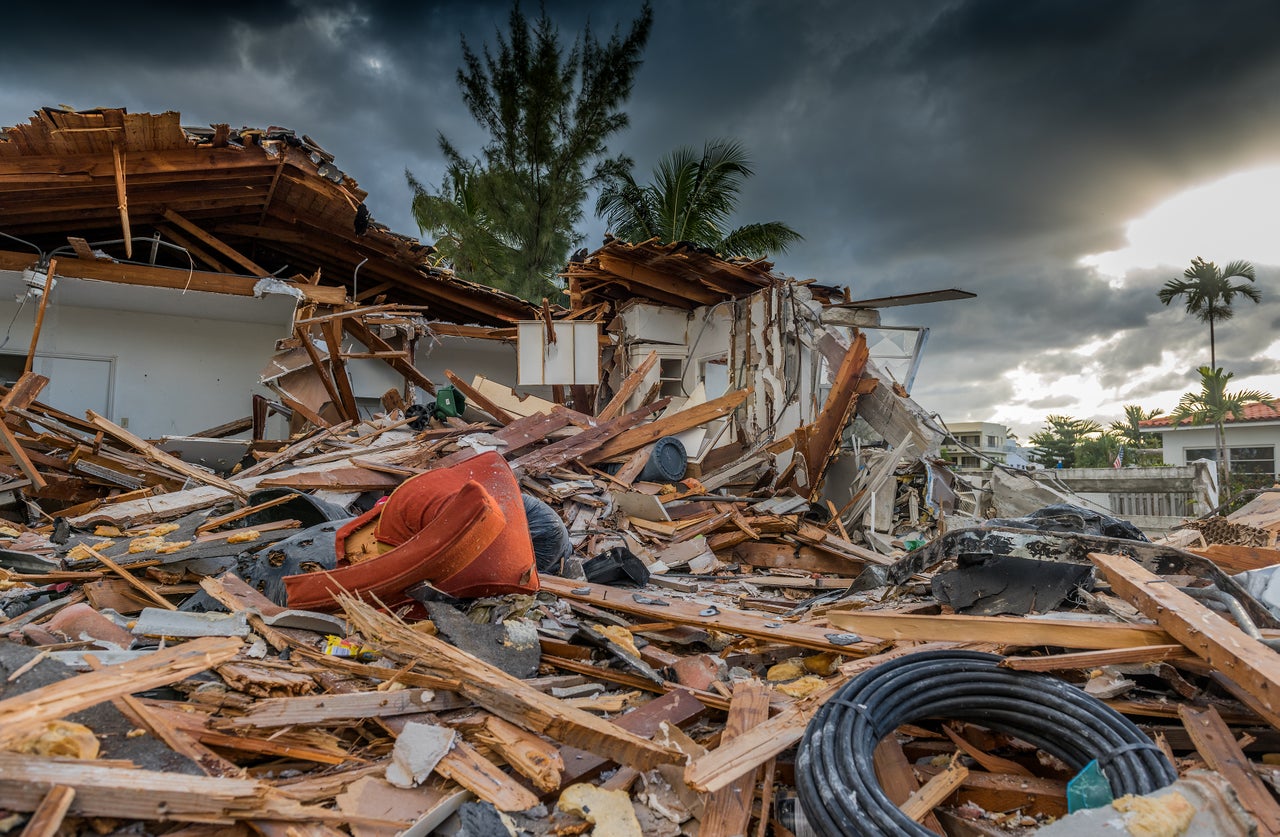
When longtime Los Angeles homeowners Michael and Elena Torres returned to their homes after the 2025 wildfires, nothing remained but charred beams and a mailbox. They’d paid premiums to the same insurer for 15 years, so they expected the claim to be straightforward. Instead, they found out their home’s reconstruction would cost about $1 million, but their policy’s dwelling limit was capped at $750,000.
That gap is an insurance-to-value (ITV) problem now surfacing across California, and Cotality found that these deltas are driving mortgage delinquencies as well as presenting a barrier to first-time homebuyers looking to qualify for loans. Skyrocketing reconstruction costs are also resulting in thousands of homeowners becoming unknowingly under-insured.
Property insurance has become the thin line between solvency and ruin in today’s fire zones. Wildfires can erase whole neighborhoods, and contractor shortages, material cost spikes, and six-figure coverage gaps can turn recovery into a significant challenge.
As premiums surge, carriers retreat. This leaves underinsured families with unexpected rebuild costs and force-placed policies push damaged loans toward delinquency. In this report, Cotality measures how total-loss events, shrinking coverage, and escalating reconstruction expenses are reshaping who can rebuild, who stays afloat, and who gets priced out of America’s growing wildfire-urban interface.
Shrinking insurance availability or affordability creates barriers to new mortgage lending
Private insurers are retreating from the wildfire-exposed West. In California’s wildland urban interface, many major insurers are no longer accepting new homeowners applications or have imposed caps on the number of policies issued in the state.
Those exits have driven unprecedented reliance on the California FAIR Plan, whose roll-book swelled to more than 452,000 policies in 2024, more than double the 2020 total.
The contraction is spreading inland: Colorado regulators note that several of the state’s five largest carriers are now writing fewer policies or declining coverage in foothill communities such as Evergreen and Boulder, while average premiums have soared nearly 60% in five years.
Oregon faces a similar squeeze; major insurers have sharply pulled back from central, southern, and eastern counties, forcing many homeowners to hunt for last-resort coverage or pay quadrupled premiums.
While carriers must make underwriting and pricing decisions that accurately reflect a location’s risk, they also need to navigate the complexities of individual state regulations.
In California, insurers that want to deploy catastrophe models for rate making must first secure approval through the PRID process and then commit to writing at least 85 % of their statewide market share in high-risk ZIP codes as identified by the commissioner. This could restore capacity in high-risk areas, but Prop 103 still requires prior approval hearings on premium filings, slowing rate adjustments to rising loss costs.
Colorado’s HB 1182, effective July 1, 2026, takes a different approach: carriers must disclose wildfire scores and classifications, give discounts for homeowner mitigation, and defend those scores on appeal. The extra compliance burden could discourage new entrants even as the law seeks to make coverage more affordable.
These supply shocks cascade straight into mortgage underwriting. Every conforming loan sold to Fannie Mae or Freddie Mac must close with property insurance, and the premium is counted in the borrower’s debt-to-income (DTI) ratio. When insurance premiums exceed 3% of buyer income, it is harder to meet the lender’s required debt-to-income ratio, sidelining first-time buyers.
In wildfire-exposed regions where premiums have surged, many entry-level borrowers now fail automated underwriting or must slash their purchase budgets, leaving listings to linger and sowing liquidity traps.
Underinsurance amid rising reconstruction costs creates challenges for existing mortgages
When reconstruction costs surge higher than dwelling limits, loan servicers often add force-placed coverage that runs roughly twice the price of a borrower’s own policy. This sudden increase in cost can eat into family budgets while borrowers scramble to cover the higher bill.
Comparison of monthly delinquency rate to December 2024
Data source: Cotality, 2025
*Comparison of the 30 to 119 days past due delinquency rate of each month compared to December 2024 by county. This is calculated by dividing the delinquency rate of each month by the delinquency rate of December 2024.
That financial squeeze appears in the Cotality True Standings Servicing data. In Los Angeles County, payments that are 30 to 119 days past due (DPD) climbed from 1.87% in December 2024 to 2.22% in February 2025 before easing to 1.90% in April this year. Meanwhile, Ventura and Orange Counties, which were spared the brunt of the January 2025 fires that hit Los Angeles, saw their delinquency rates decrease over the same period.
The 2025 Los Angeles Fires: Recovery stalled by contractor shortages, high costs, and underinsurance
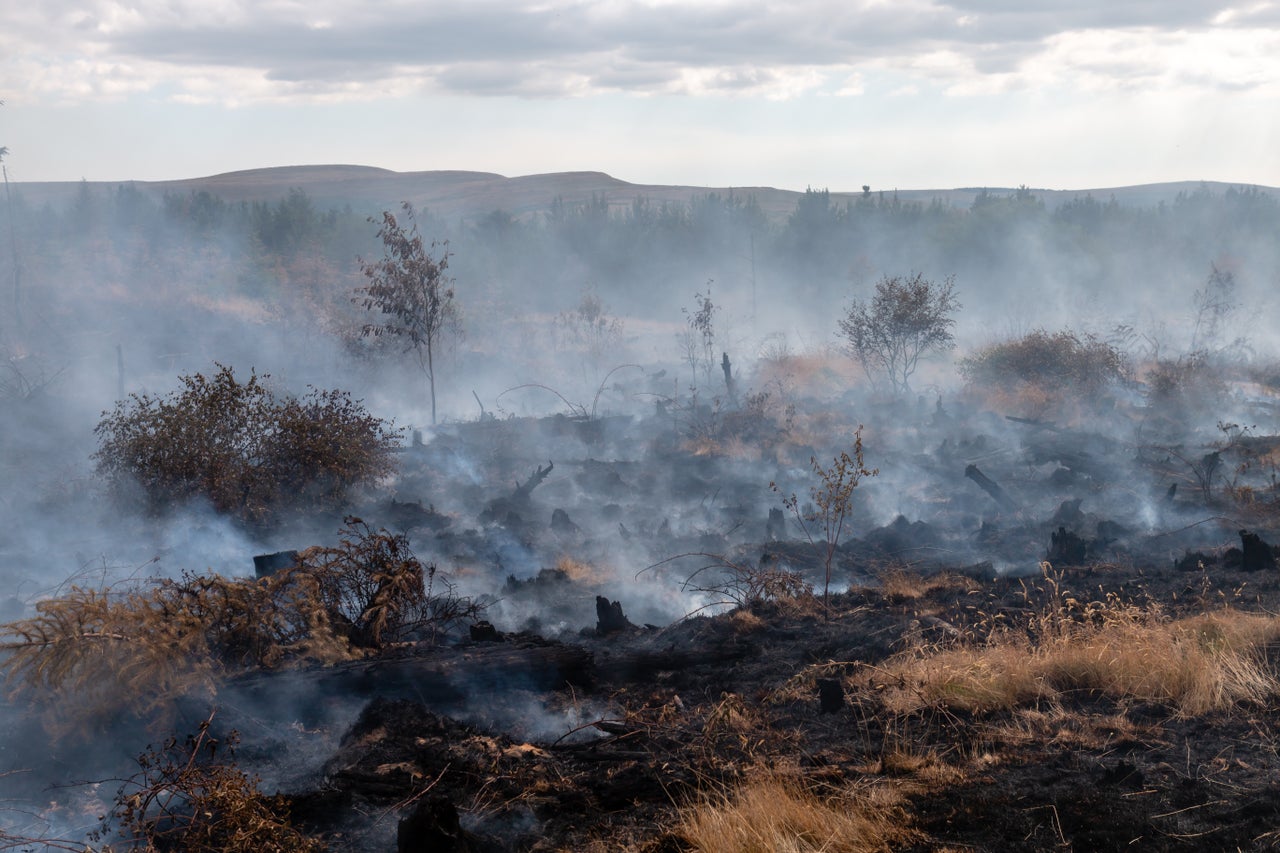
On January 7, 2025, two devastating wildfires broke out in Los Angeles, California, damaging over 13,500 properties and resulting in more than $40 billion insured losses. The Palisades Fire and the Eaton Fire left such damage in their wakes that the communities of Altadena and Pasadena will face months of rebuilding challenges.
Nine months after the fires, barely a dent has been made in rebuilding thousands of lost homes. LA County’s dashboard showed fewer than 50 rebuilding permits issued by late May, and Altadena officials said only 15 permits had been issued for the Eaton burn-scar.
A chronic shortage of skilled contractors is a major obstacle; builders face a tight labor market, and even after recent rate cuts, construction loan interest rates still hover between 10% and 12%, squeezing both contractors and homeowners. This, combined with inflated material costs amid demand surge, is creating significant challenges for recovery.
The scale of Los Angeles’ rebuilding task is magnified for many residents who discovered that they were under-insured in the aftermath of the fires. Cotality found that typical payouts in fire-hit Los Angeles neighborhoods do not cover rebuild estimates, leaving six-figure gaps that many families cannot absorb.
Wildfire risk is not just a California problem
All across the western U.S., wildfire risk is redefining landscapes. But risk varies from property to property. Even next-door neighbors can have different risk scores due to their property’s slope, aspect, fuel, surface composition, drought, and winds.
Residential properties and their wildfire risk score throughout the western United States
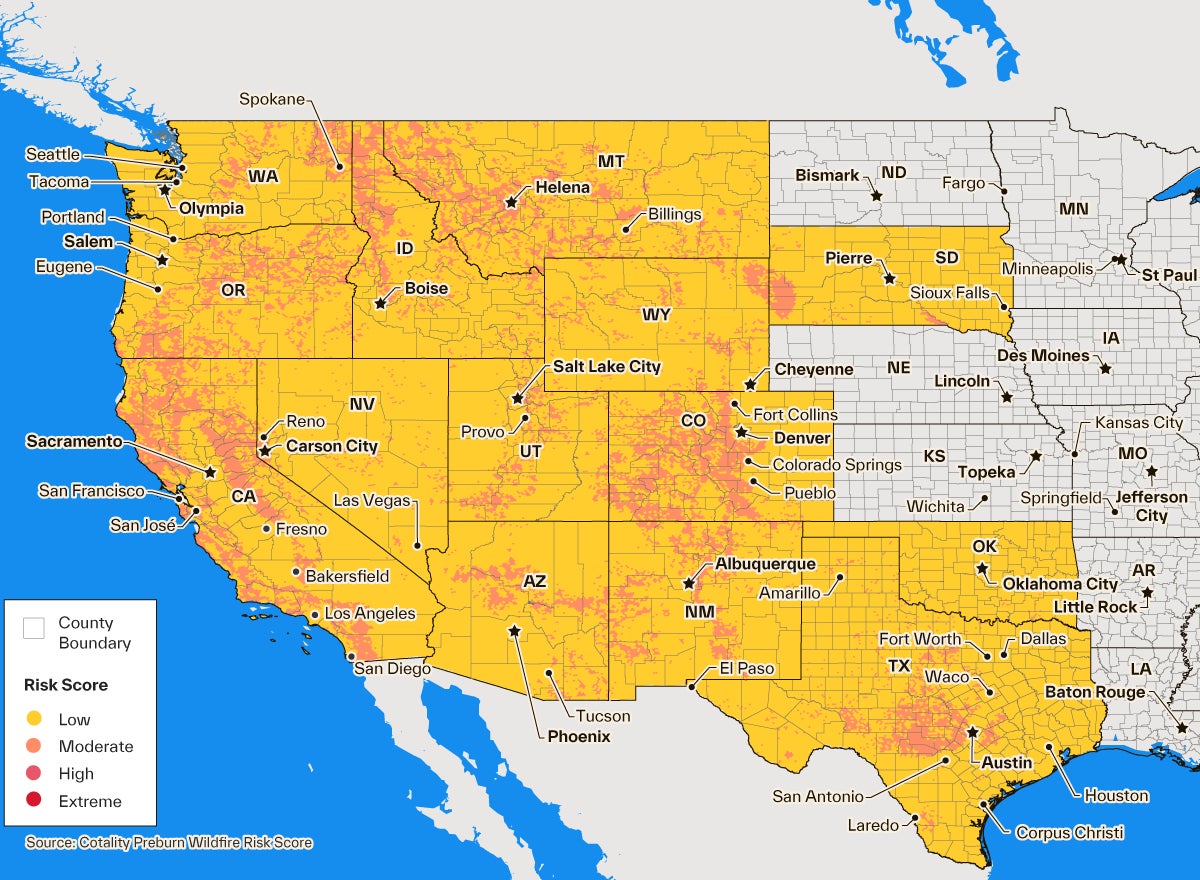
Data source: Cotality, 2025
By examining the quantity of homes and their reconstruction cost value (RCV) based on wildfire risk scores, we can understand individual risk levels as well as the entirety of the risk landscape. This holistic approach is crucial for effectively assessing and managing wildfire threats.
The scores in this analysis reflect the current risk landscape as of July 2025 for selected states.
Homes per state with moderate or higher risk and respective reconstruction cost value
Data source: Cotality, 2025
There are nearly 2.6 million homes at moderate or greater risk with a combined reconstruction cost value of $1.3 trillion in the western U.S. in 2025. Approximately 1.2 million homes, nearly half of the homes with elevated wildfire risk (e.g., moderate and above), have very high wildfire risk.
Residential properties and their wildfire risk score in California
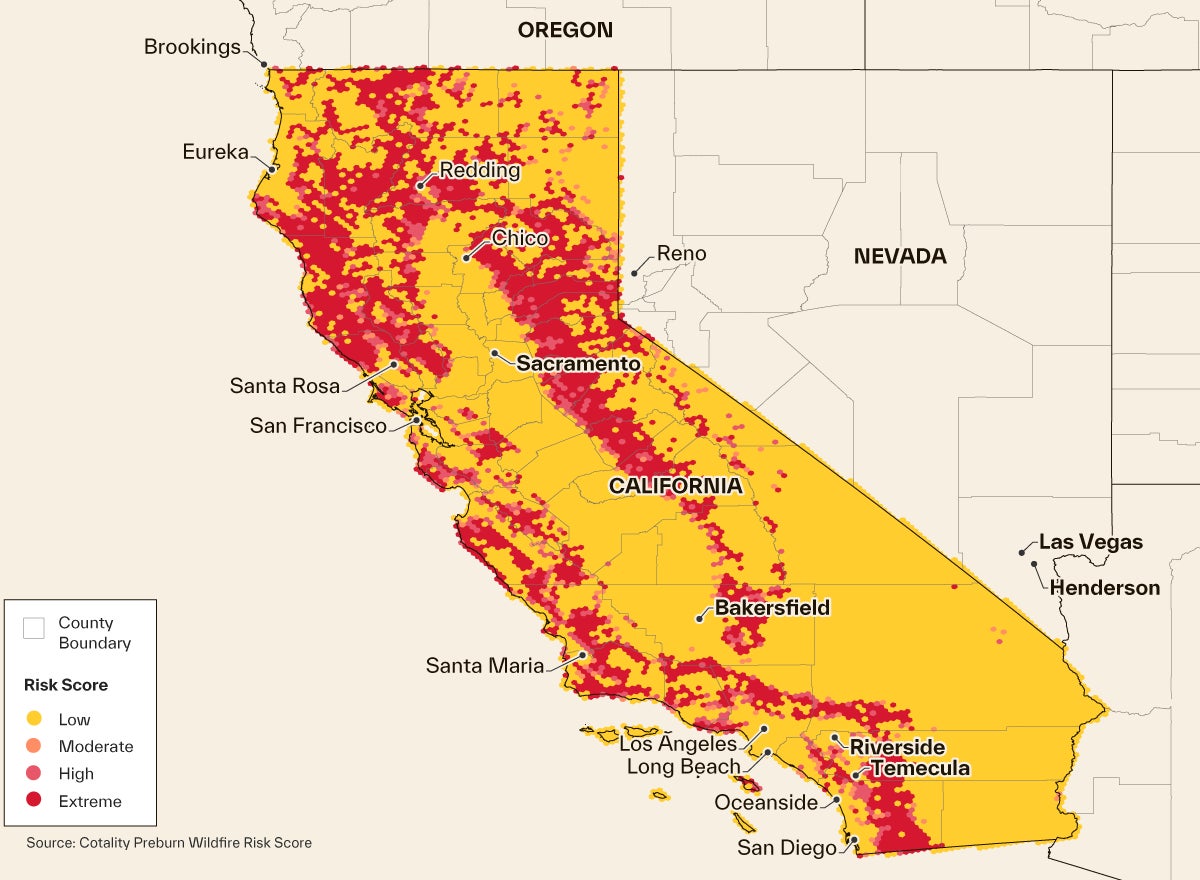
Data source: Cotality, 2025
Residential properties and their wildfire risk score in Texas
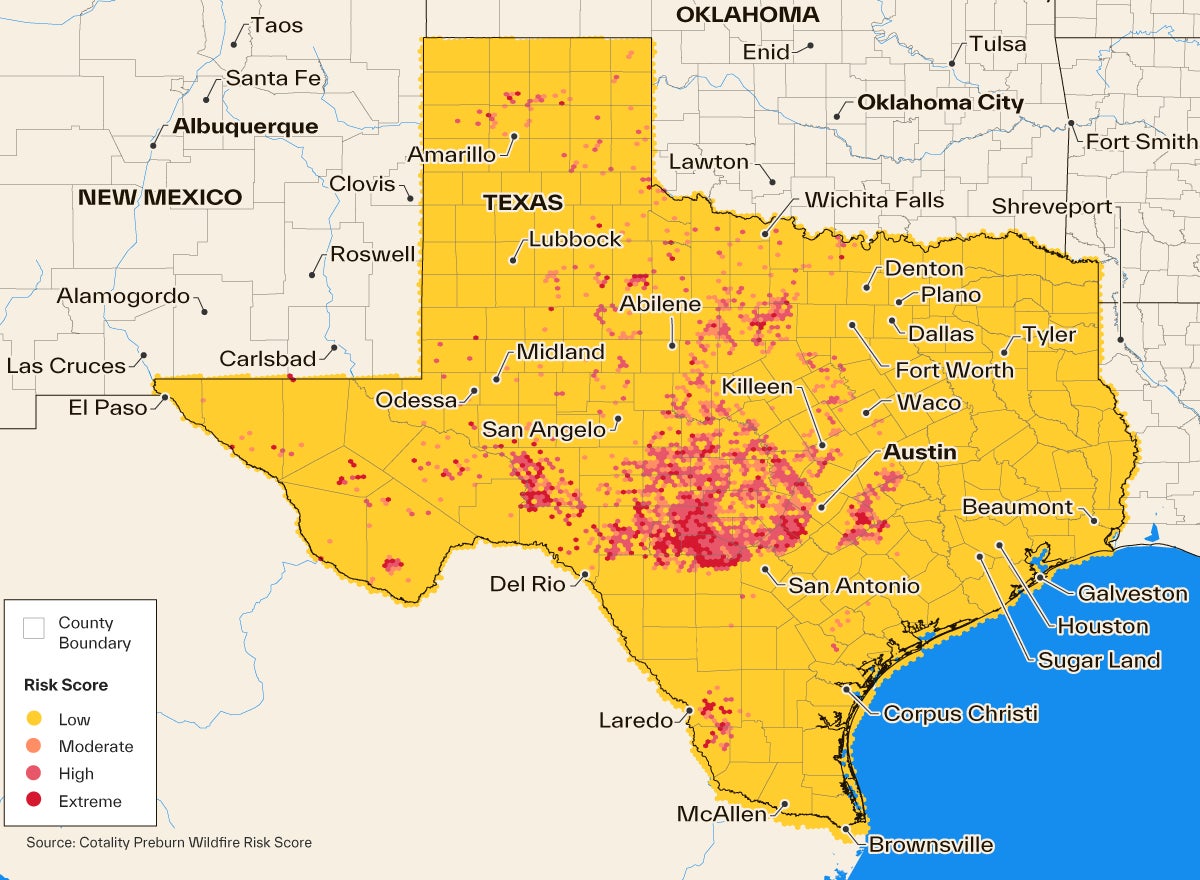
Data source: Cotality, 2025
Residential properties and their wildfire risk score in Colorado
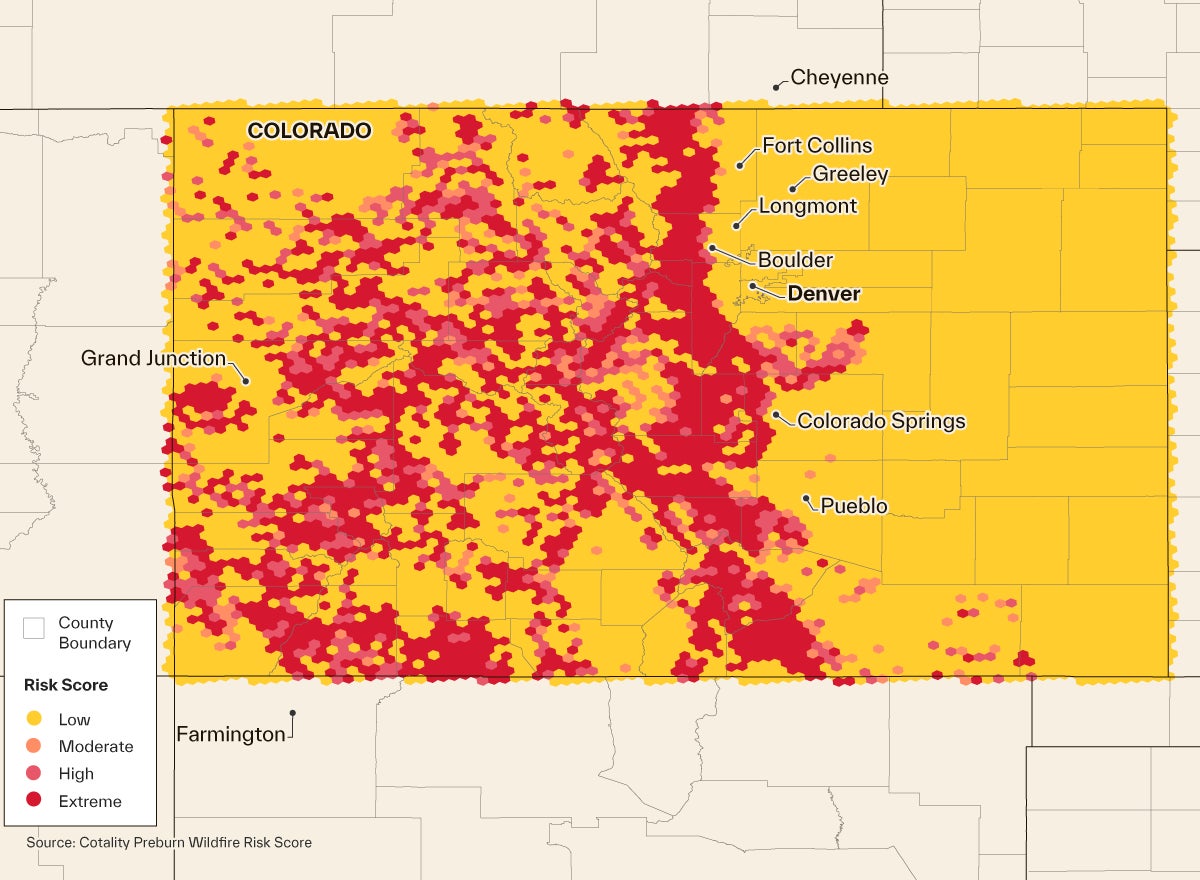
Data source: Cotality, 2025
Total number of at-risk homes
Data source: Cotality, 2025
Total reconstruction cost value for at-risk homes
Data source: Cotality, 2025
California, Colorado, and Texas have more homes with elevated wildfire risk than all the other states Cotality modeled. While California claims eight of the 15 most at-risk metropolitan areas, Austin, TX; Denver, CO; Bend, OR; and Flagstaff, AZ metropolitan areas also sit among the nation’s top 15 areas in number of homes with moderate-to-high wildfire risk.
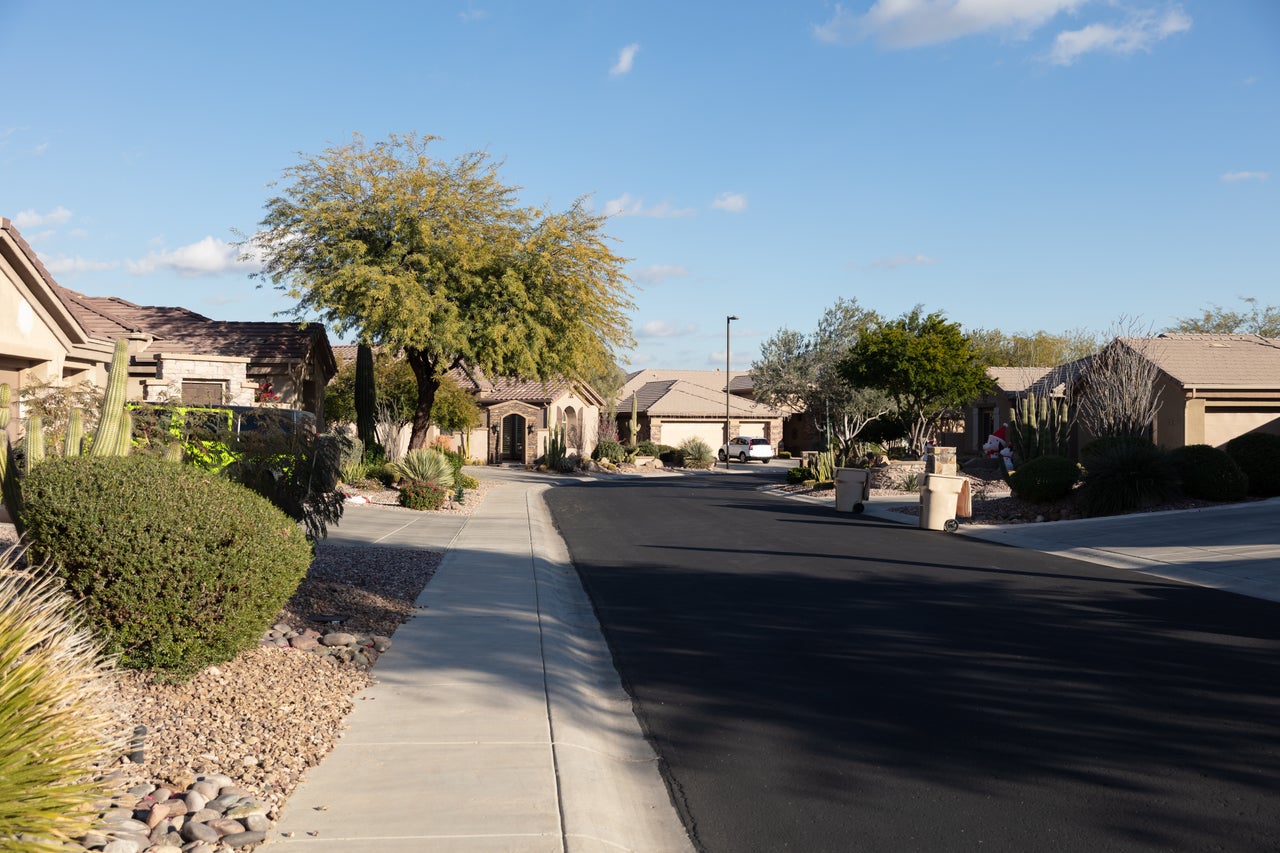
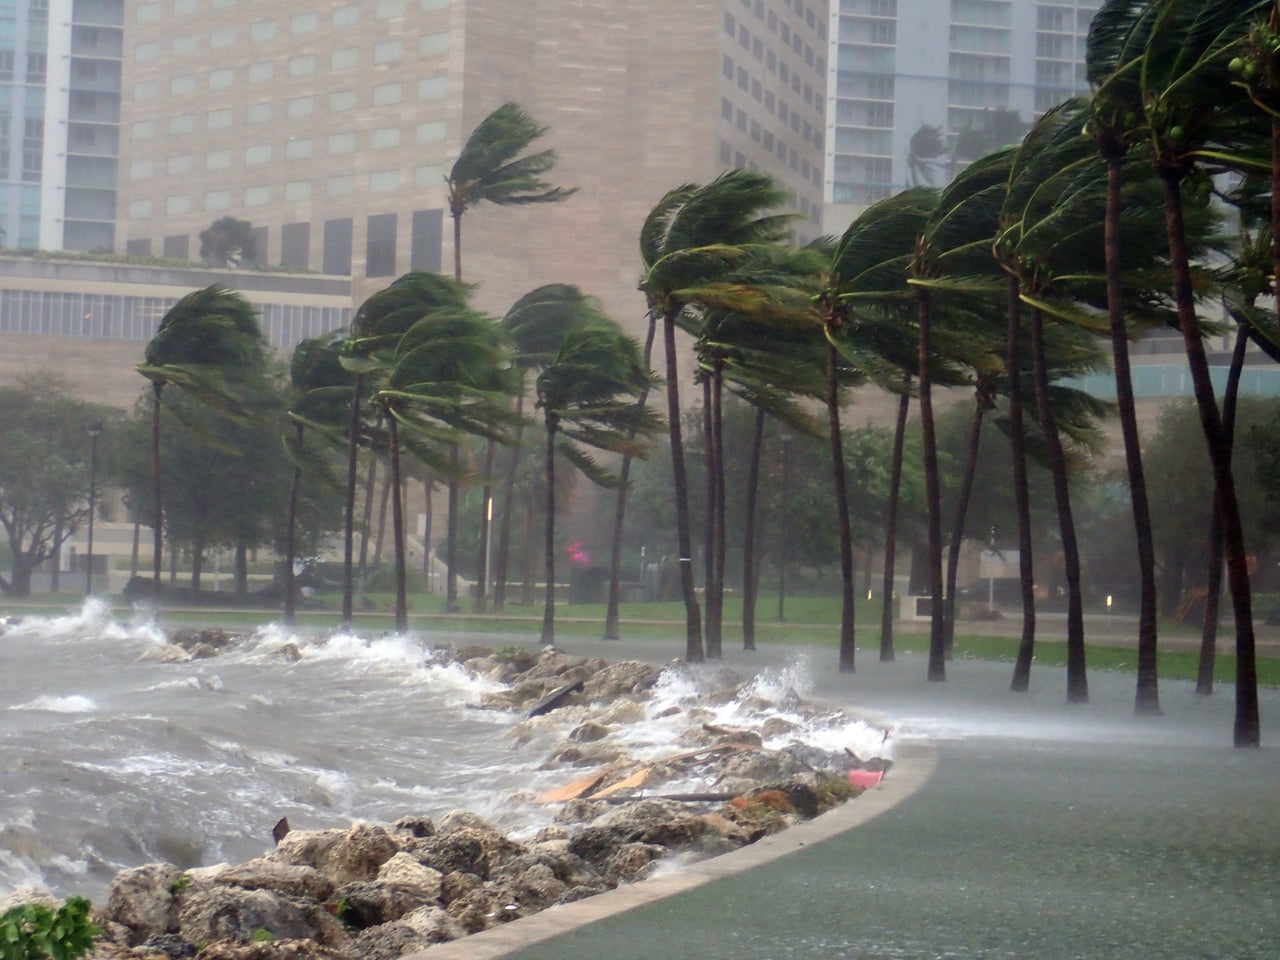
What puts these metros at the top of the list? Homes with proximity to nature. More homes are being built in the Wildland-Urban Interface (WUI) where their adjacency to forested or undeveloped areas elevates their risk.
The stakes are rising, and not just in the WUI. Decades of fire suppression have packed forests with dense fuel loads, population growth in the wildland urban interface has placed more people and property at risk, and hotter, drier seasons now stretch the period when vegetation can ignite.
Homes with moderate or higher risk by metropolitan area and their respective reconstruction cost value
Data source: Cotality, 2025
Cotality data shows that Los Angeles has the most homes with moderate or greater wildfire risk. The nearly 241,000 homes with moderate or greater risk profiles represent a reconstruction cost value of over $191 billion.
Residential properties and their wildfire risk score in the Los Angeles, California Metropolitan Area
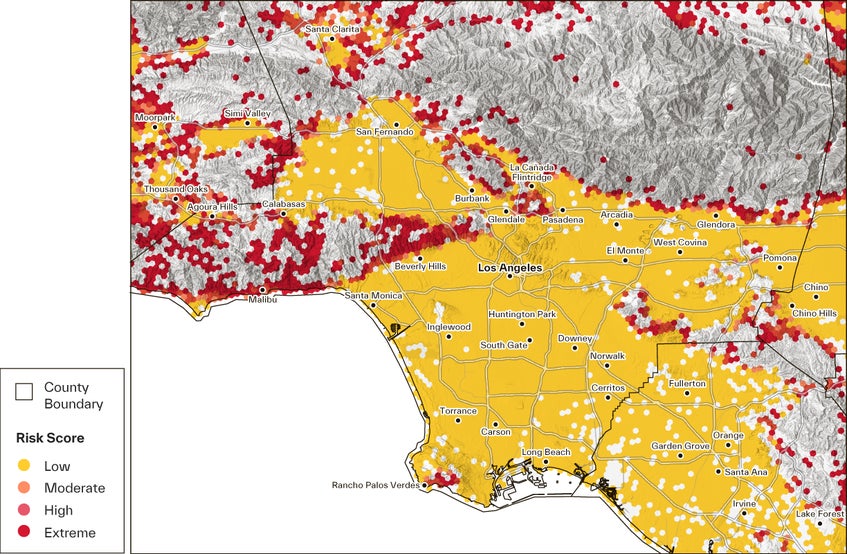
Data source: Cotality, 2025
Residential properties and their wildfire risk score in the Austin, Texas Metropolitan Area
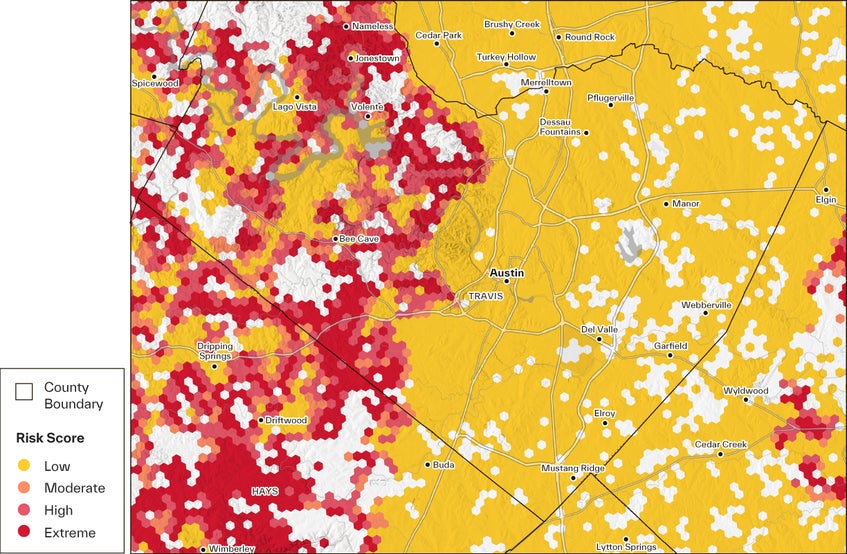
Data source: Cotality, 2025
Residential properties and their wildfire risk score in the Denver, Colorado Metropolitan Area
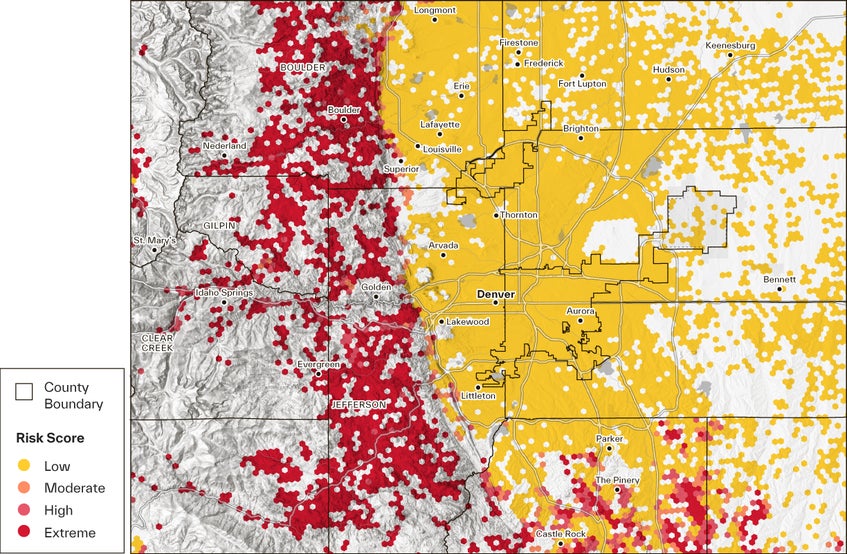
Data source: Cotality, 2025
Residential properties and their wildfire risk score in the Bend, Oregon Metropolitan Area
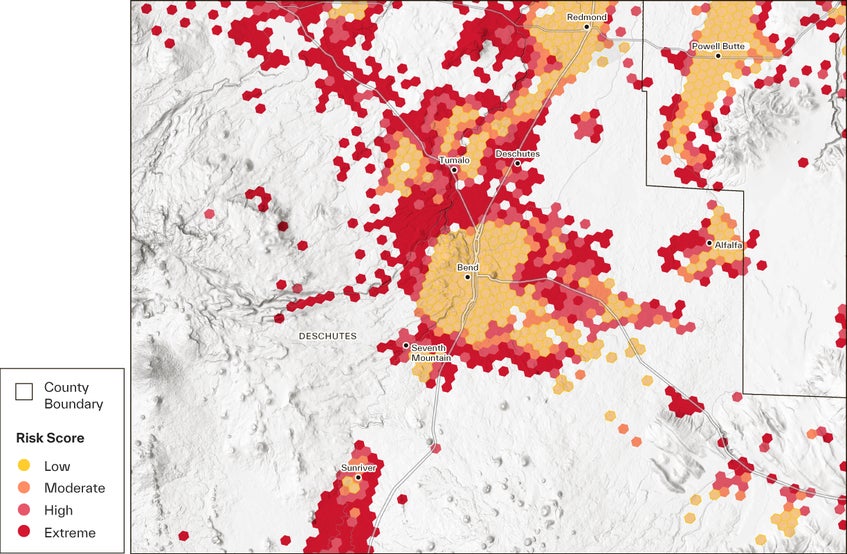
Data source: Cotality, 2025
Residential properties and their wildfire risk score in the Flagstaff, Arizona Metropolitan Area
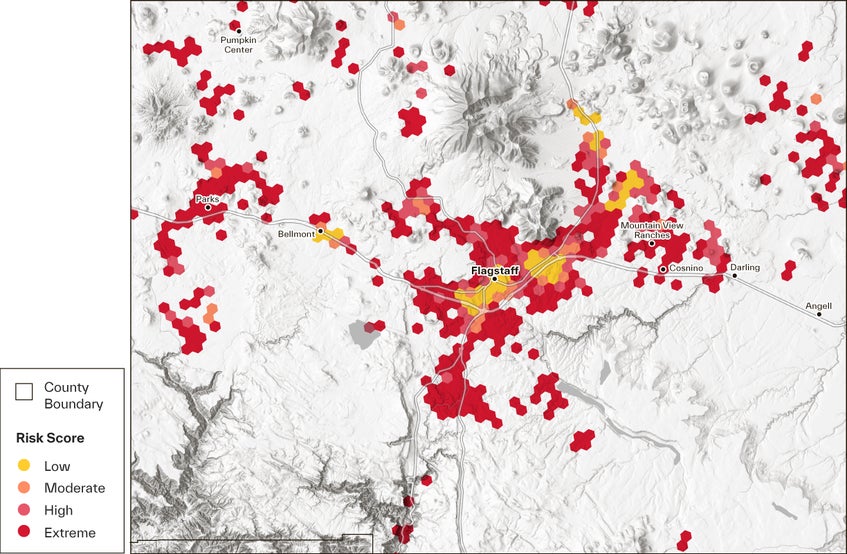
Data source: Cotality, 2025
The complexity of wildfire hazard
Although both the Palisades and Eaton fires in Los Angeles began as typical wildfires, they evolved into a different type of phenomenon: wildfire-induced conflagration.
Conflagration occurs when the primary fuel source shifts from vegetation to the built environment. While this transition may seem subtle, it fundamentally alters the fire’s behavior, impacting how it spreads, where it travels, and the scale of its potential destruction.
Since 2020, at least 10 major wildfire-induced conflagrations — events including the Palisades and Eaton fires, the 2023 Lahaina fire in Hawaii, and the 2021 Marshall fire in Colorado — have destroyed more than 26,000 structures. This rising trend highlights the urgent need to improve how we identify and manage at-risk properties. As wildfire seasons grow longer and more intense, it becomes increasingly important to assess both wildfire and conflagration hazards to effectively understand and mitigate the total threat landscape.
Wildfire-induced conflagrations are emblematic of why wildfire risk assessment needs a modern, parcel-centric approach. Many of the structures affected by these fires were deemed as low wildfire risk. However, these properties proved highly vulnerable to structure-to-structure ignition, a hallmark of conflagration exposure.
Cotality conducted a retrospective analysis of the Palisades and Eaton fires using the Wildfire Risk Score (WFRS) and Wildfire Conflagration Score products. The analysis found that properties assessed as low or moderate wildfire hazard may still face high or very high conflagration risk, especially in wildfire-prone areas.
There is now a critical need to evaluate both traditional wildfire hazard and the distinct, but related, conflagration threat. These two metrics offer more holistic insight into how a fire may develop and spread for more accurate risk assessment.
- Eaton Fire:
- 75% of properties within the fire perimeter were rated low-to-moderate wildfire hazard while also having high conflagration hazard.
- 84% of affected or destroyed structures fell into this category.
- Palisades Fire:
- 37% of properties within the perimeter were classified as low-to-moderate wildfire hazard yet had high conflagration hazard.
- 48% of destroyed properties fell into this category.
Know Your Risk. Accelerate Your Recovery®
The 2025 Los Angeles fires exposed the widening gap between yesterday’s policy limits and today’s rebuild prices. Underinsurance, record construction costs, and shrinking private coverage have slowed rebuilding across the West, while wildfire-induced conflagration threatens millions of homes once labeled low hazard.
Closing this vulnerability demands parcel-level analytics that integrate wildfire and conflagration scores, frequent insurance-to-value reviews, and mitigation incentives so homeowners, lenders, and carriers can keep capital and people in place. Without swift, data-driven action, more families will be priced out, burned out, or both.
Change begins with a new perspective. That’s where data comes in. With it, communities can rebuild faster, protect equity, and strengthen resilience against the next inevitable fire.
© 2025 Cotality. All rights reserved. While all of the content and information is believed to be accurate, the content and information is provided by Cotality “as is” with no guarantee, representation, or warranty, express or implied, of any kind including but not limited to as to the merchantability, non-infringement of intellectual property rights, completeness, accuracy, applicability, or fitness, in connection with the content or information and Cotality assumes no responsibility or liability whatsoever for the content or information or any reliance thereon. Cotality™, the Cotality logo, Intelligence beyond bounds™, and Know Your Risk. Accelerate Your Recovery® are the trademarks of CoreLogic, Inc. d/b/a Cotality or its affiliates or subsidiaries.


.jpg)