


Press Release
U.S. mortgage delinquency rate finishes 2025 flat year-over-year


Local market variations emerge as nearly half of metro areas see rising delinquency rates.
- The national mortgage delinquency rate remained unchanged from December 2024, holding at 3.2%.
- Serious delinquencies edged higher, reflecting a modest uptick from late 2024 levels.
- Foreclosure inventory stayed near historic lows, continuing to hover close to the lowest rate ever recorded.
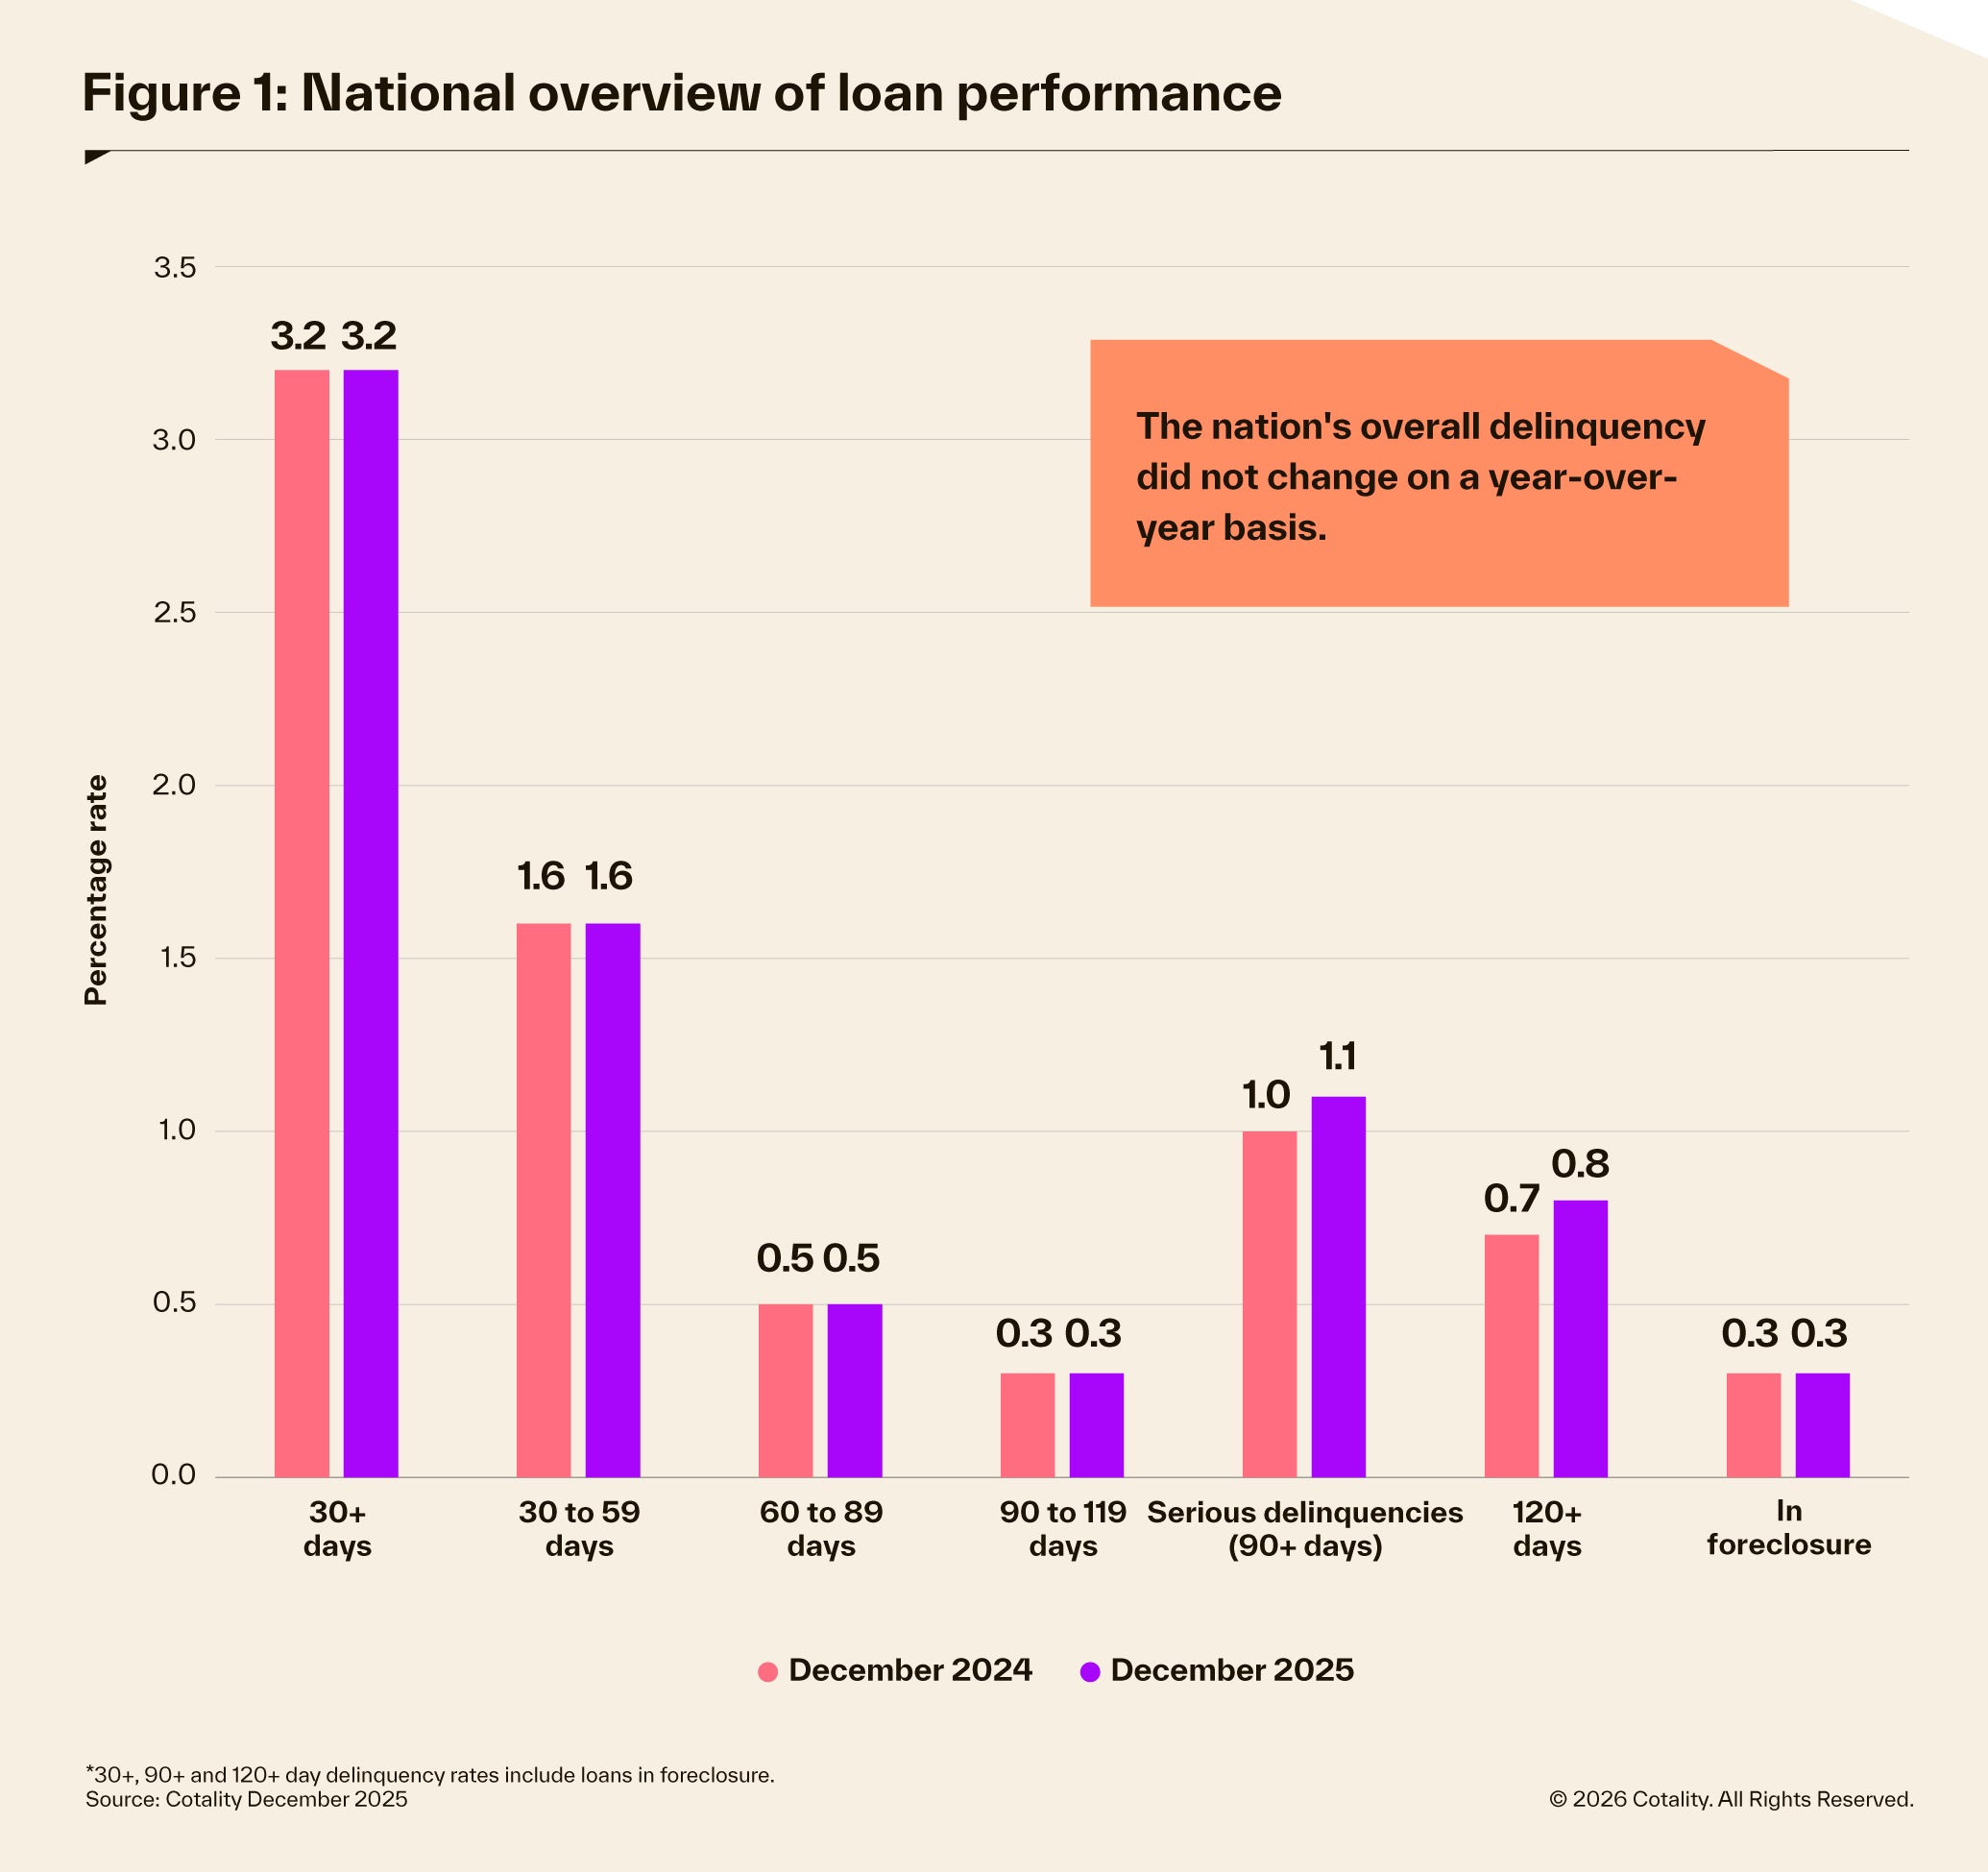
IRVINE, Calif., February 26, 2026 – Cotality, a leading global property information, analytics, and data-enabled solutions provider, today released its latest Loan Performance Indicators, which analyzes mortgage delinquencies nationally and across major metropolitan areas. In December 2025, the share of mortgages in some stage of delinquency (30 or more days past due, including foreclosures) was 3.2%, which was unchanged from 2024. Delinquencies increased slightly from 3% in the third quarter of 2025.
“Delinquency activity ended 2025 on a remarkably even footing, with the national rate showing very little directional movement over the past several months,” said Molly Boesel, Senior Principal Economist at Cotality. “What stands out this quarter are the differences emerging at the local level. While the national picture appears calm, nearly half of metropolitan areas experienced an uptick in overall delinquencies, serious delinquencies, and foreclosures. That breadth of localized increases suggests that pockets of households are coming under greater financial strain, even if it’s not yet visible in the national aggregates. As we move into 2026, these metro‑level shifts will be important to watch for early signals of changing borrower performance.”
Despite a modest increase from the mid-2024 low, the December 2025 delinquency rate remains well below the 12% peak recorded in 2010.
Cotality examines all delinquency stages to gain a comprehensive view of the mortgage market and loan performance. In December 2025, the U.S. delinquency and transition rates and their year-over-year changes were as follows:
- Early-Stage Delinquencies (30 to 59 days past due): 1.6%, unchanged from 1.6% in December 2024.
- Adverse Delinquency (60 to 89 days past due): 0.5%, unchanged from December 2024.
- Serious Delinquency (90 days or more past due, including loans in foreclosure): 1.1%, an increase from 1% in December 2024. The serious delinquency rate has been moving in a narrow range of 0.9% to 1.1% since June 2024.
- Transition Rate (the share of mortgages that transitioned from current to 30 days past due): 0.7%, down from 0.8% in December 2024.
State and Metro Takeaways
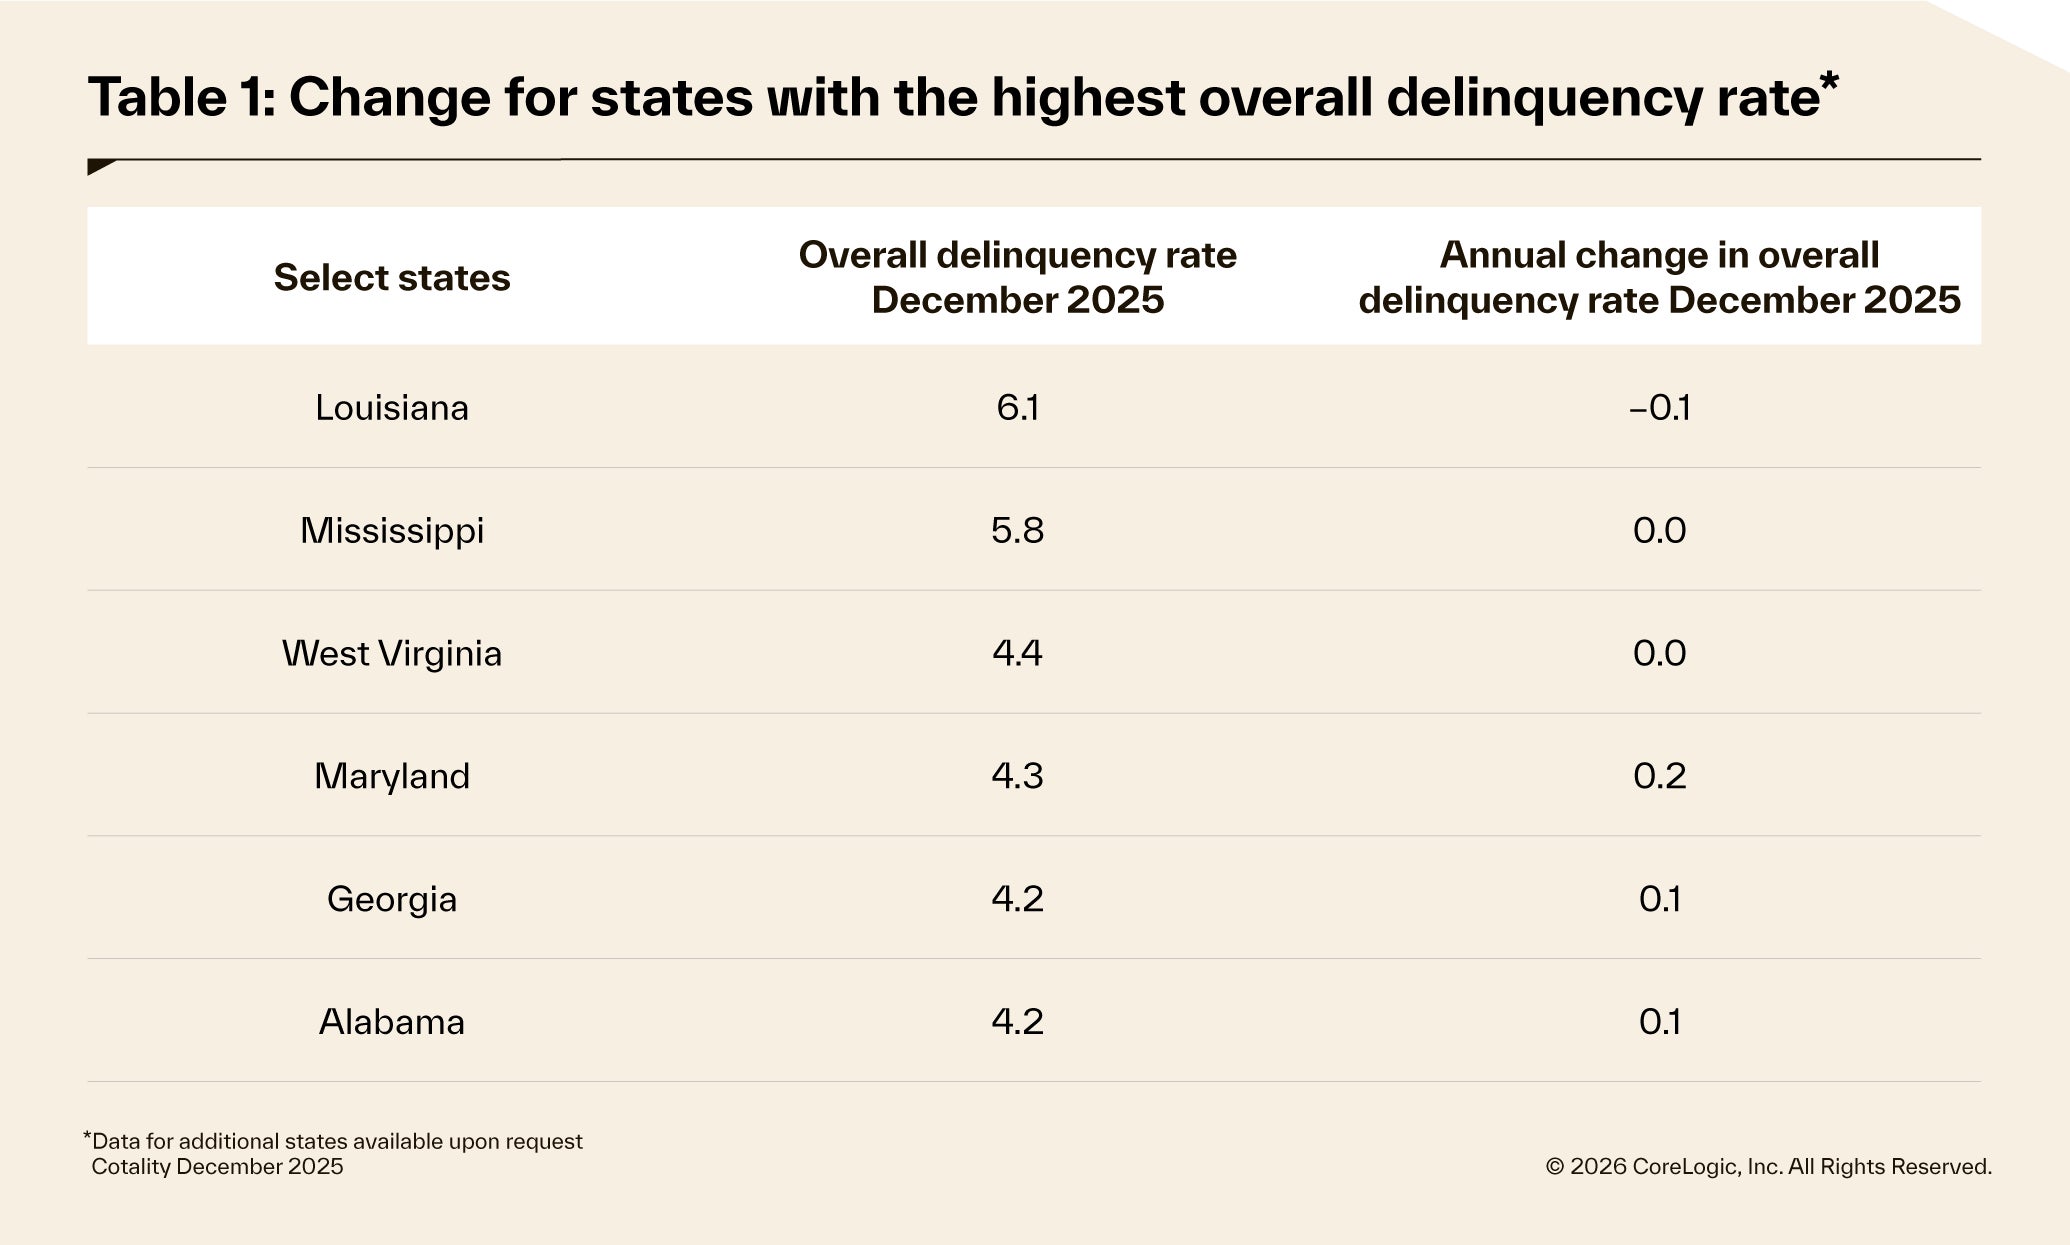
In December 2025, 23 states logged year-over-year increases in their overall delinquency rate in December 2025. The locations with the highest increases were Maryland (up 0.4 percentage points) and Nevada (up 0.3 percentage points). All other states had changes ranging between -0.6 and 0.2 percentage points.
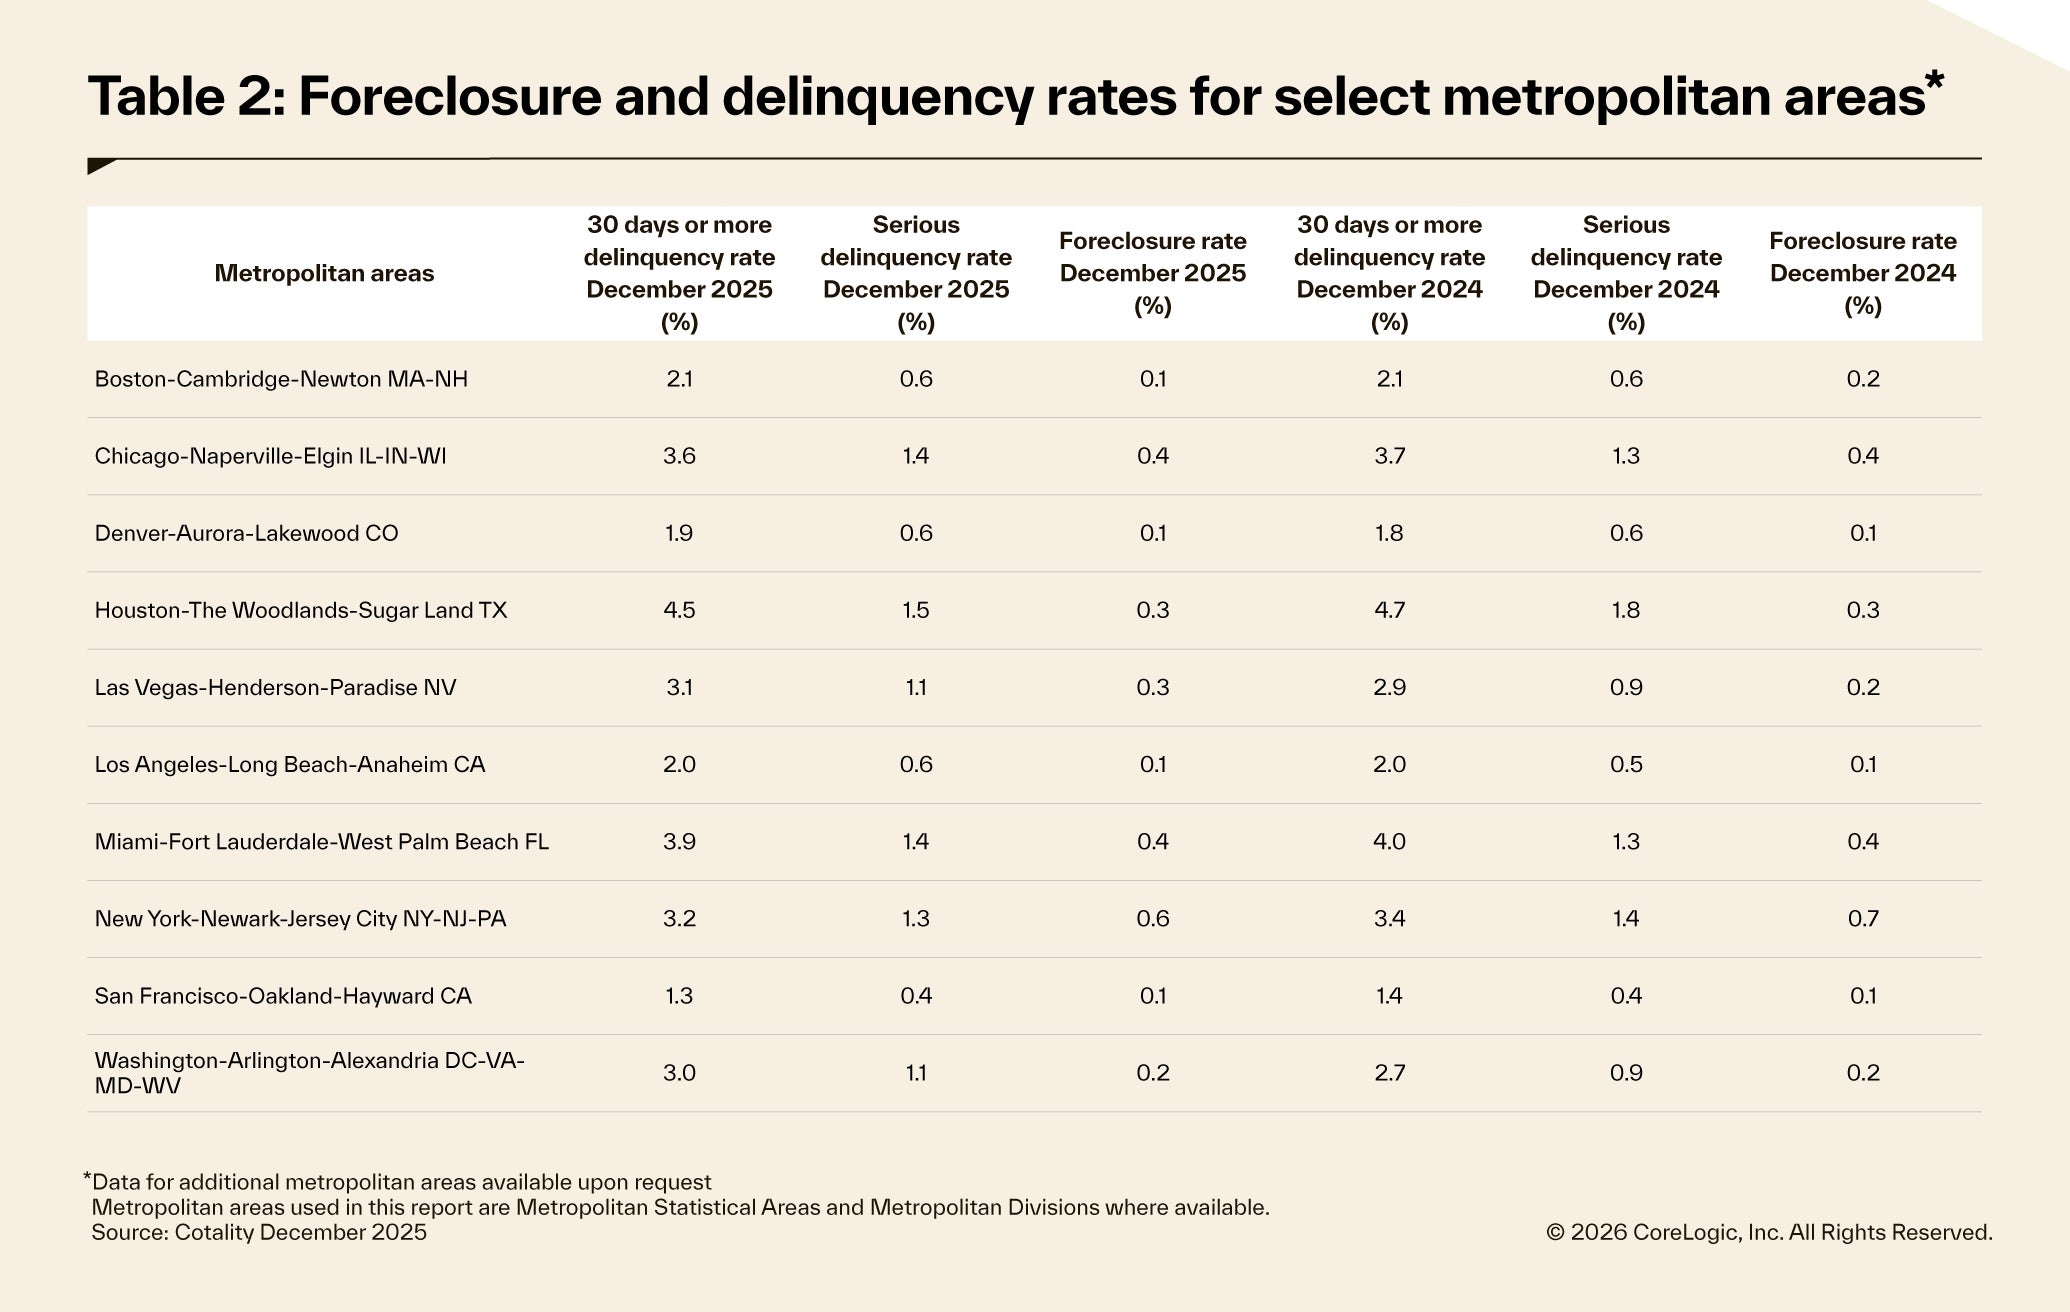
In December 2025, 184 out of 384 U.S. metropolitan areas posted an annual increase in their overall delinquency rate. The top areas include Odessa, Texas (up 1.3 percentage points); Laredo, Texas (up 0.9 percentage points); Danville, Illinois; Lima, Ohio; Jonesboro, AR; McAllen- Edinburg-Mission, Texas (all up 0.6 percentage points). All other year-over-year changes ranged between -2.8 and 0.5 percentage points.
In December 2025, 183 metropolitan areas posted annual increases in their serious delinquency rates. The top areas include Odessa, TX; San Angelo, TX (both up 0.8 percentage points); Farmington, New Mexico (up 0.6 percentage points). All other year-over-year changes ranged between -1.2 and 0.5 percentage points.
The next Cotality Loan Performance Insights Report will be released on May 28, 2026, featuring data for the first quarter of 2026. For ongoing housing trends and data, visit the Cotality Insights Blog
Methodology
The data in the Cotality LPI report represents foreclosures and delinquency activity reported through December 2025. The data in this report accounts only for first liens against a property and does not include secondary liens. The delinquency, transition, and foreclosure rates are measured only against homes that have outstanding mortgages. Homes without mortgage “liens” are not subject to foreclosure and are, therefore, excluded from the analysis. Cotality has approximately 75% coverage of U.S. foreclosure data. This data is compiled from public records, contributory databases, and proprietary analytics, and its accuracy is dependent upon these sources.
Source: Cotality
The data provided is for use only by the primary recipient or the primary recipient’s publication or broadcast. This data may not be resold, republished, or licensed to any other source, including publications and sources owned by the primary recipient’s parent company, without prior written permission from Cotality. Any Cotality data used for publication or broadcast, in whole or in part, must be sourced as coming from Cotality, a data and analytics company. For use with broadcast or web content, the citation must directly accompany the first reference of the data. If the data is illustrated with maps, charts, graphs, or other visual elements, the Cotality logo must be included on screen or website. For questions, analysis, or interpretation of the data, contact newsmedia@cotality.com. Data provided may not be modified without the prior written permission of Cotality. Do not use the data in any unlawful manner.
About Cotality
Cotality accelerates data, insights, and workflows across the property ecosystem to enable industry professionals to surpass their ambitions and impact society. With billions of real-time data signals across the life cycle of a property, we unearth hidden risks and transformative opportunities for agents, lenders, carriers, and innovators. Get to know us at www.cotality.com.
Media Contact
Charity Head
Cotality