


Press Release
Southern rents slow while prices climb in northern climes


Subdued annual rent growth masks regional variations, with the South continuing to diverge from the national average.
- U.S. single-family rent prices increased 1.3% year over year in March 2026.
- Among the 10 largest metros, Chicago, Philadelphia, and New York saw the largest annual rent gains in March 2026. Across the 50 largest metros, 16 posted decreases, with the steepest drops concentrated in Florida.
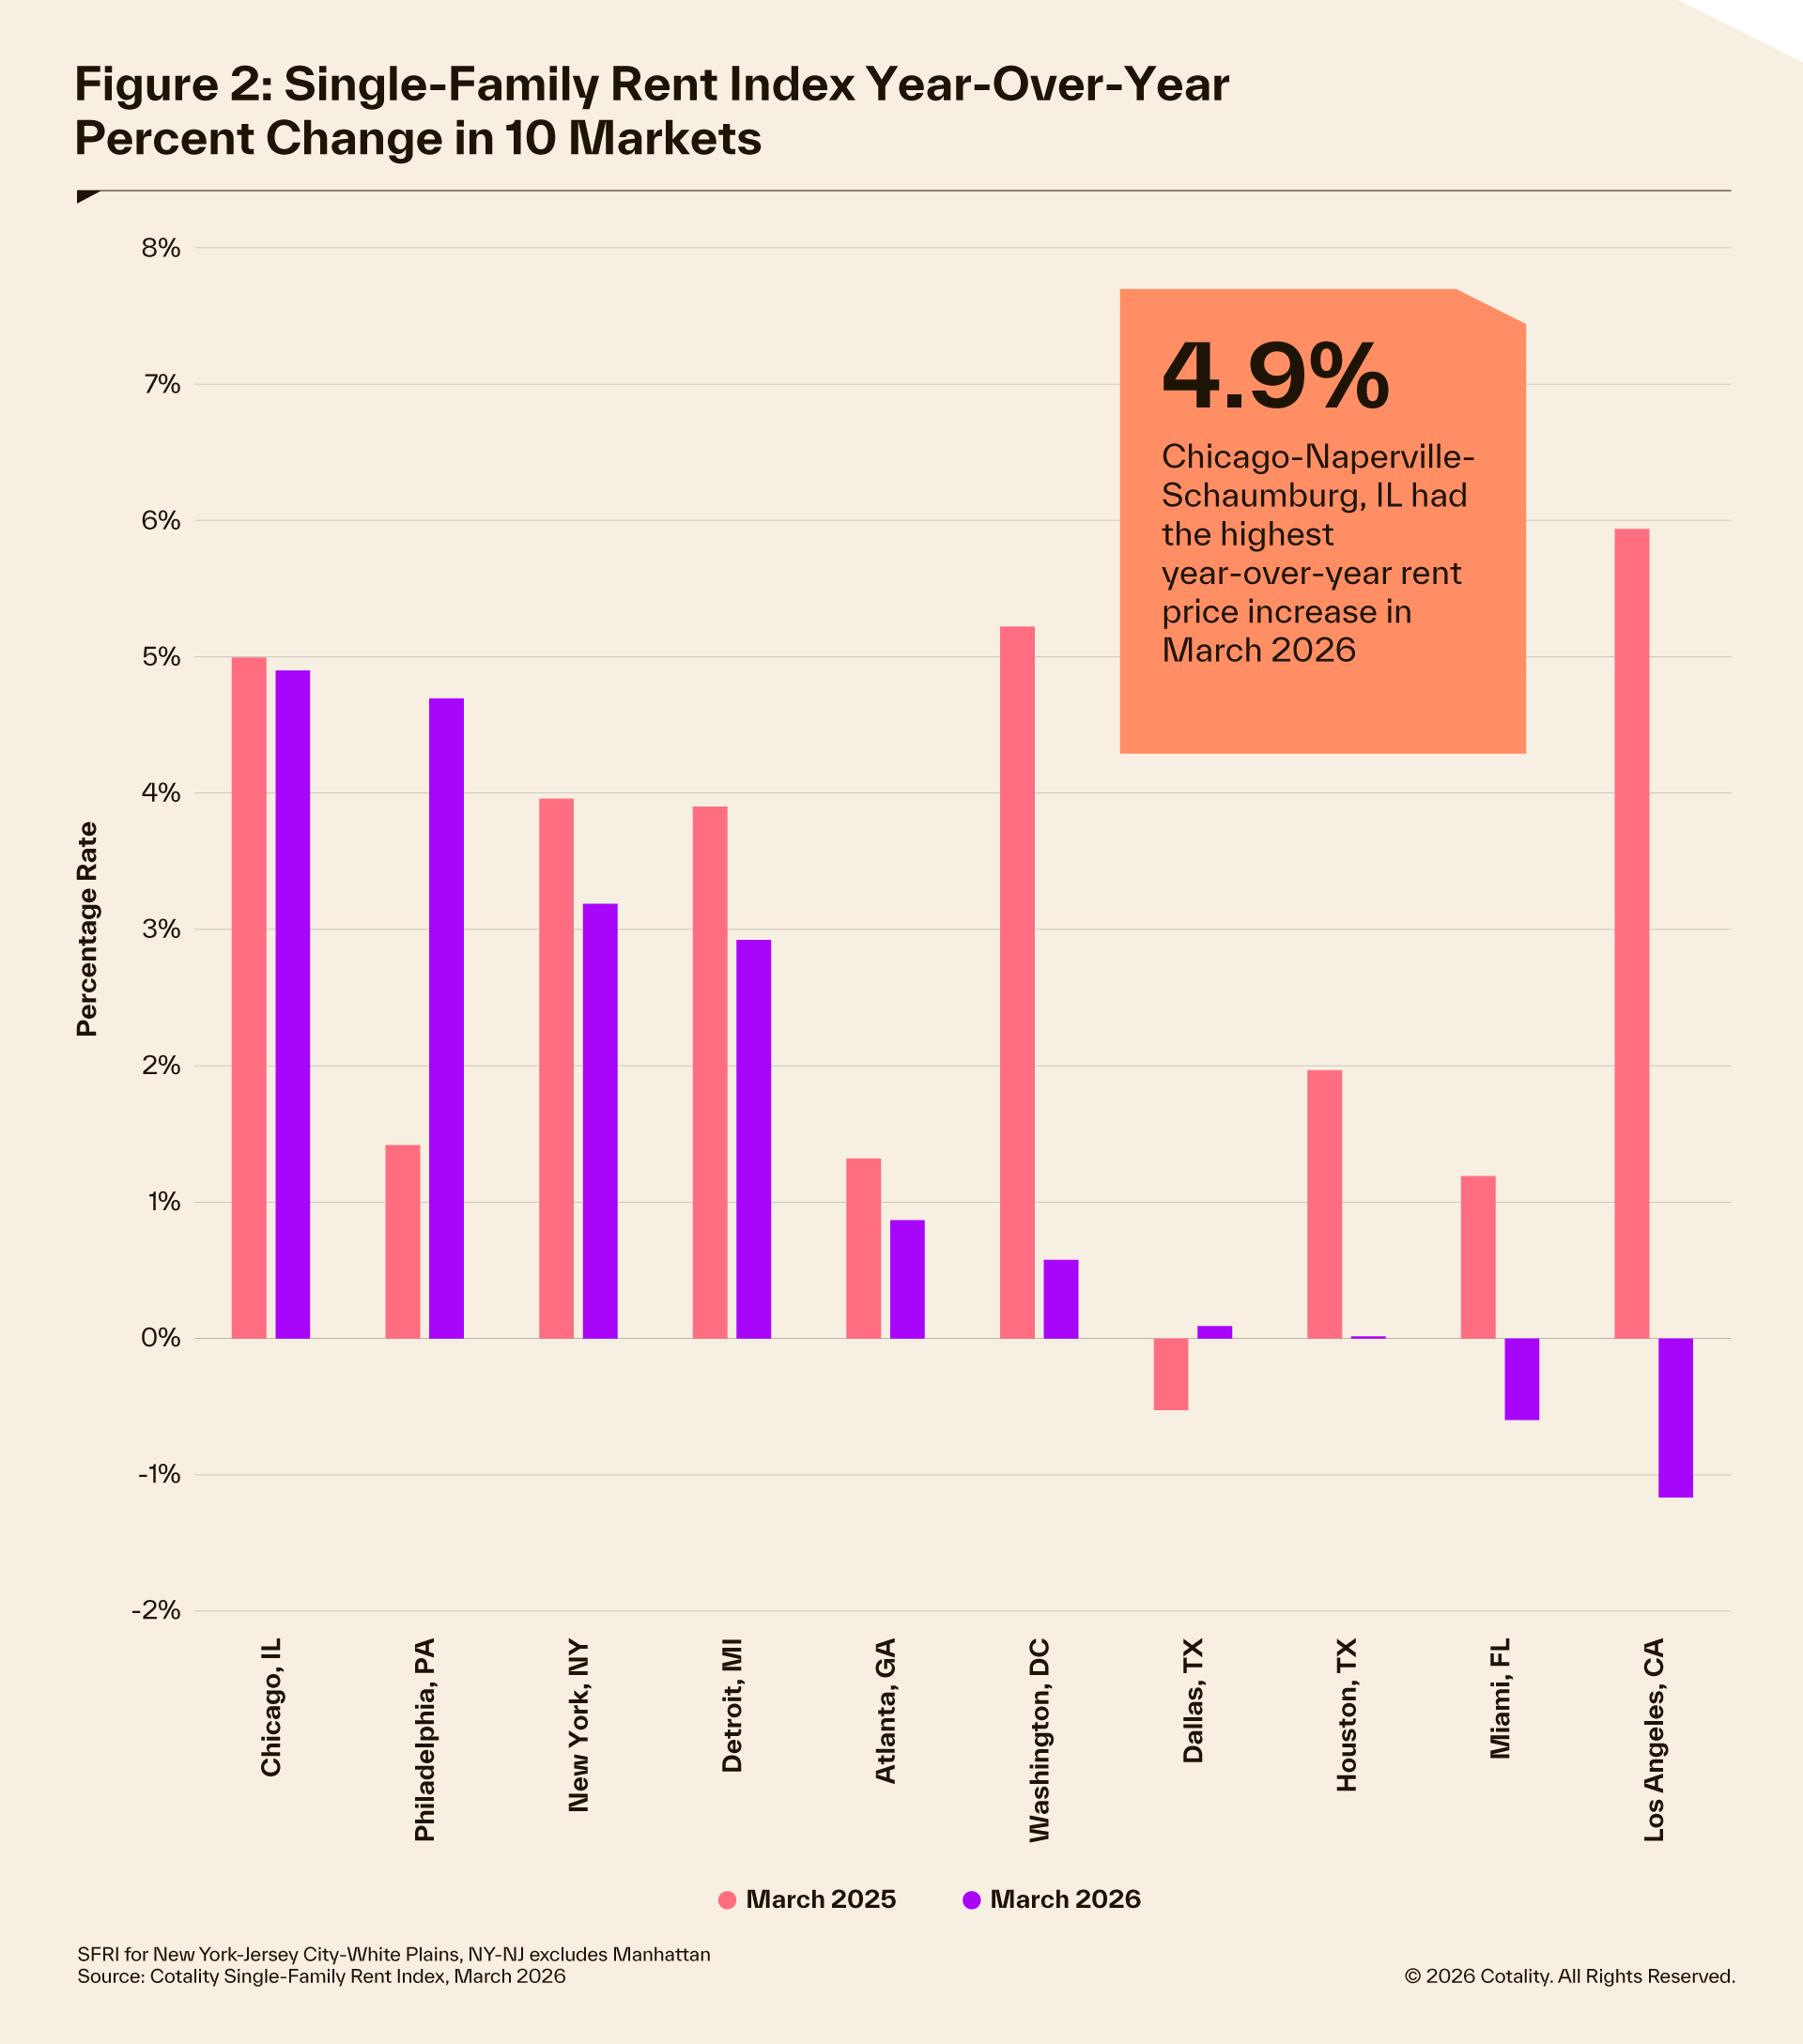
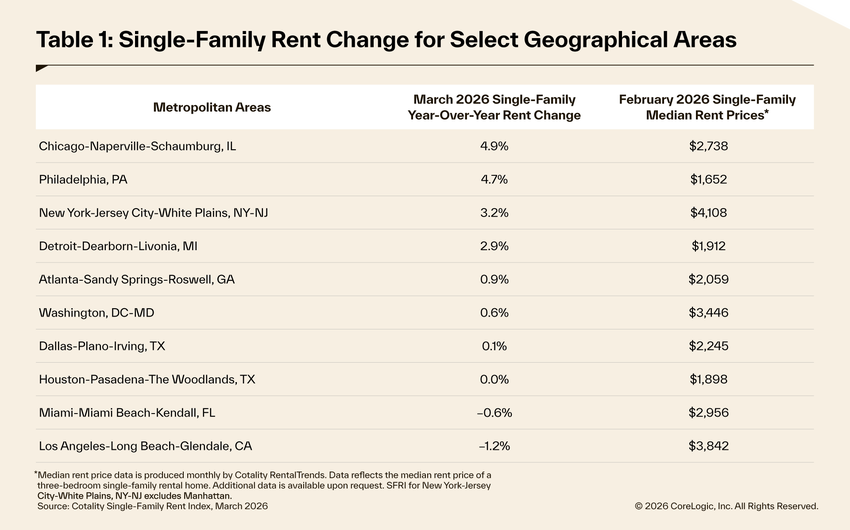
- Chicago, IL, continued to see the largest increases in March 2026 at 4.9%.
IRVINE, Calif., May 21, 2026 – Cotality, a leading global property information, analytics, and data-enabled solutions provider, released its latest Single-Family Rent Index (SFRI) with March 2026 data, which analyzes single-family rent price changes nationally and across major metropolitan areas. Single-family rent prices in March 2026 increased 1.3% year over year. This increase is a drop-off from the 2.7% increase we saw between March 2024 and 2025.
"Although rent growth remained subdued in March — with growth now at about one-third of its pre-pandemic pace and well below last year’s levels — month-over-month trends indicate some near-term strengthening, as rents rose 1.0% in March, outpacing the typical seasonal increase,” said Molly Boesel, senior principal economist at Cotality. “Market conditions beneath the national average remain highly uneven. Rent growth has slowed in 70% of large metros, but the number of outright declines decreased in March, suggesting that geographic softening may be stabilizing. As in previous months, declines were concentrated in Florida, which had 10 of the 16 declines. Chicago and Philadelphia continue to see some of the strongest gains, while Los Angeles recorded its second annual decline since the 2025 wildfires, indicating that rents are continuing to normalize after earlier disruptions."
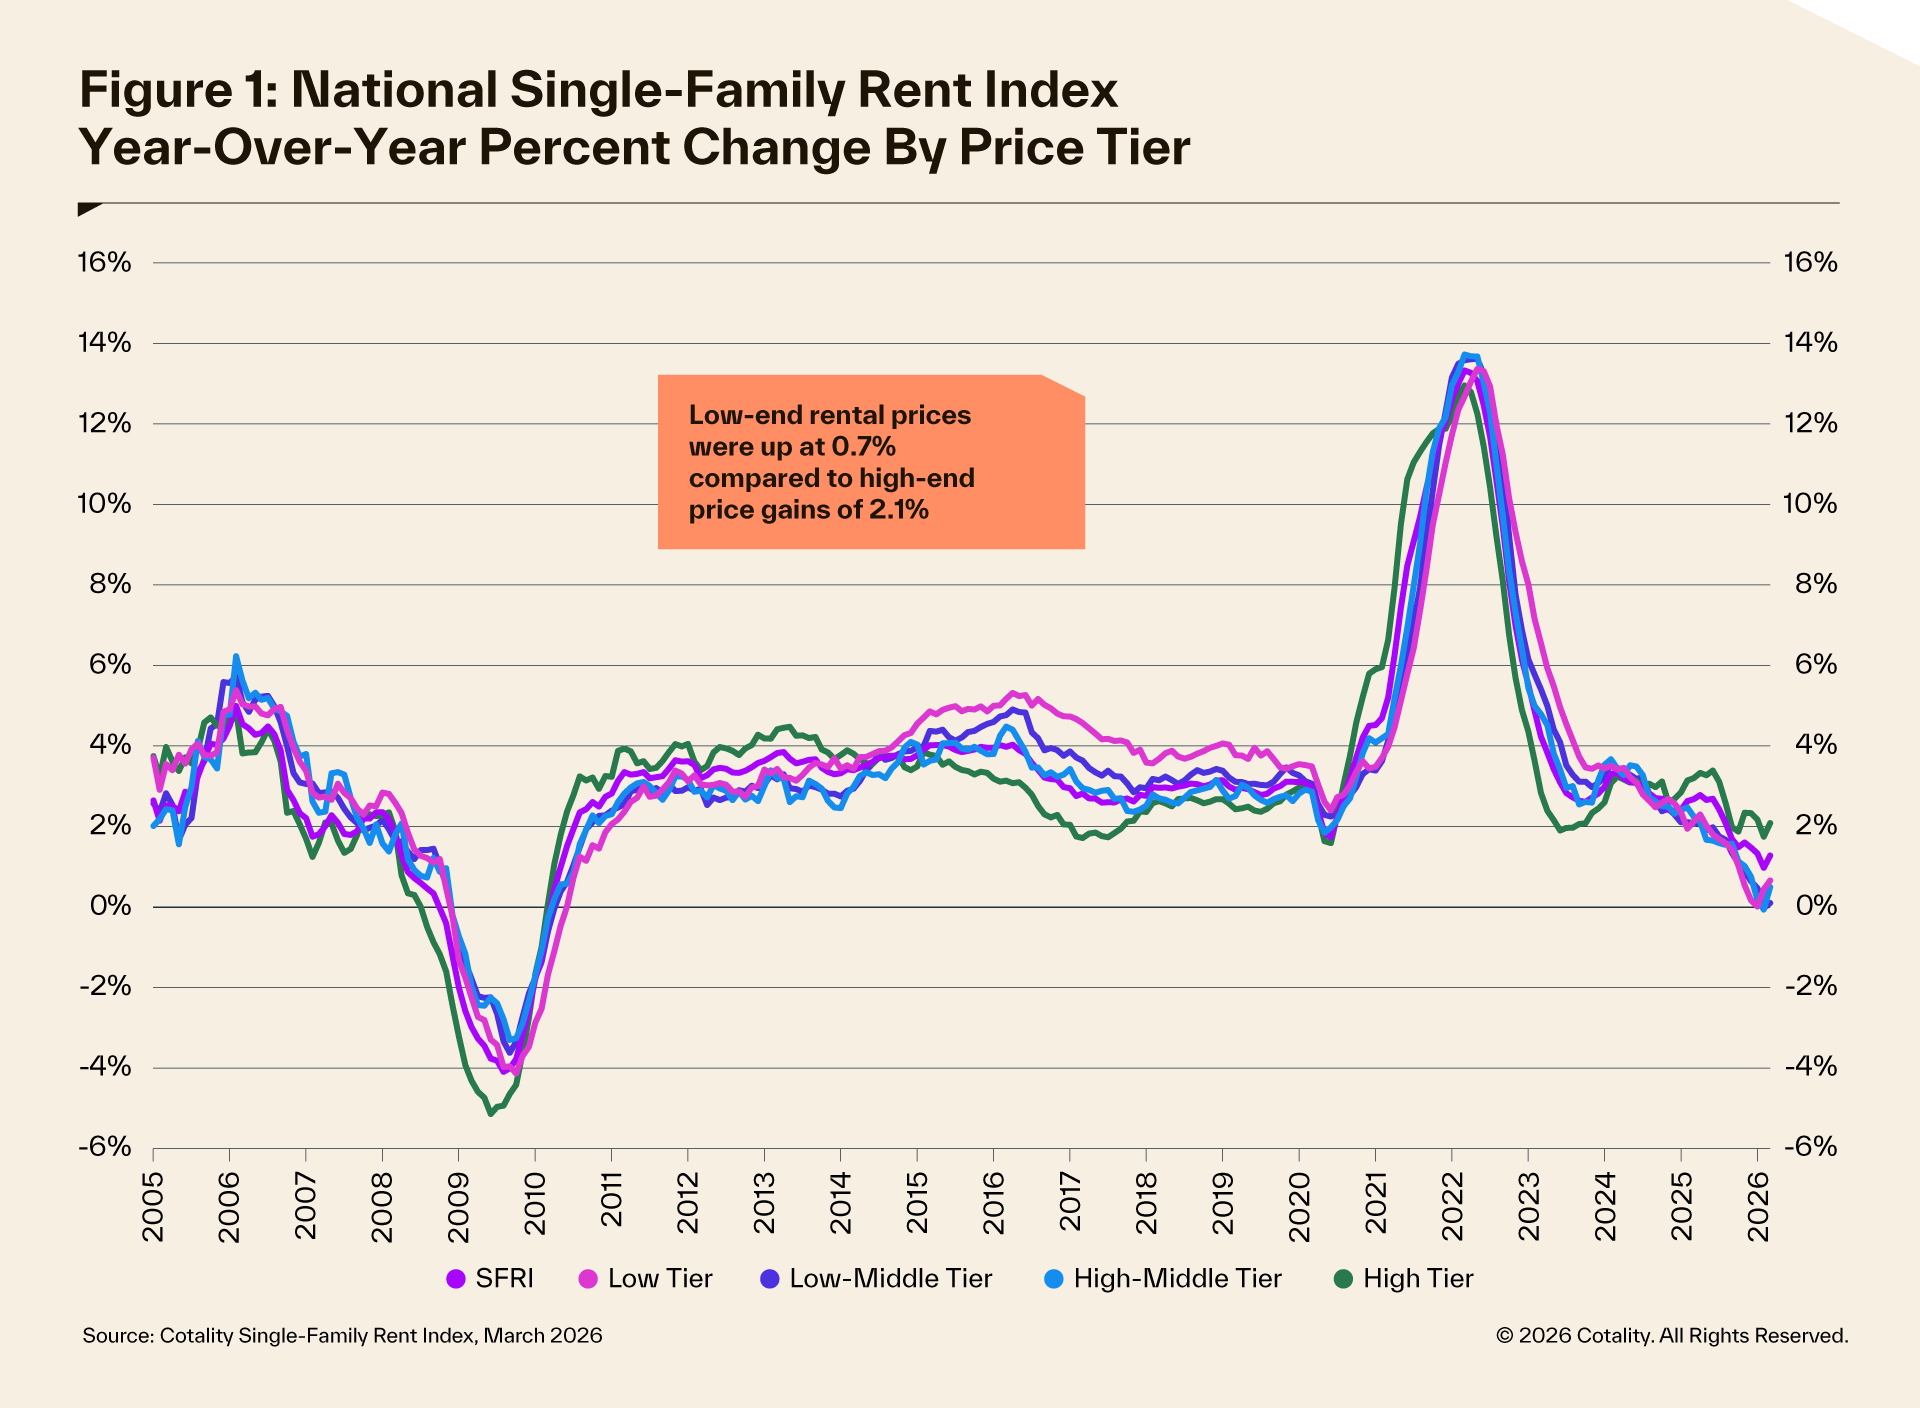
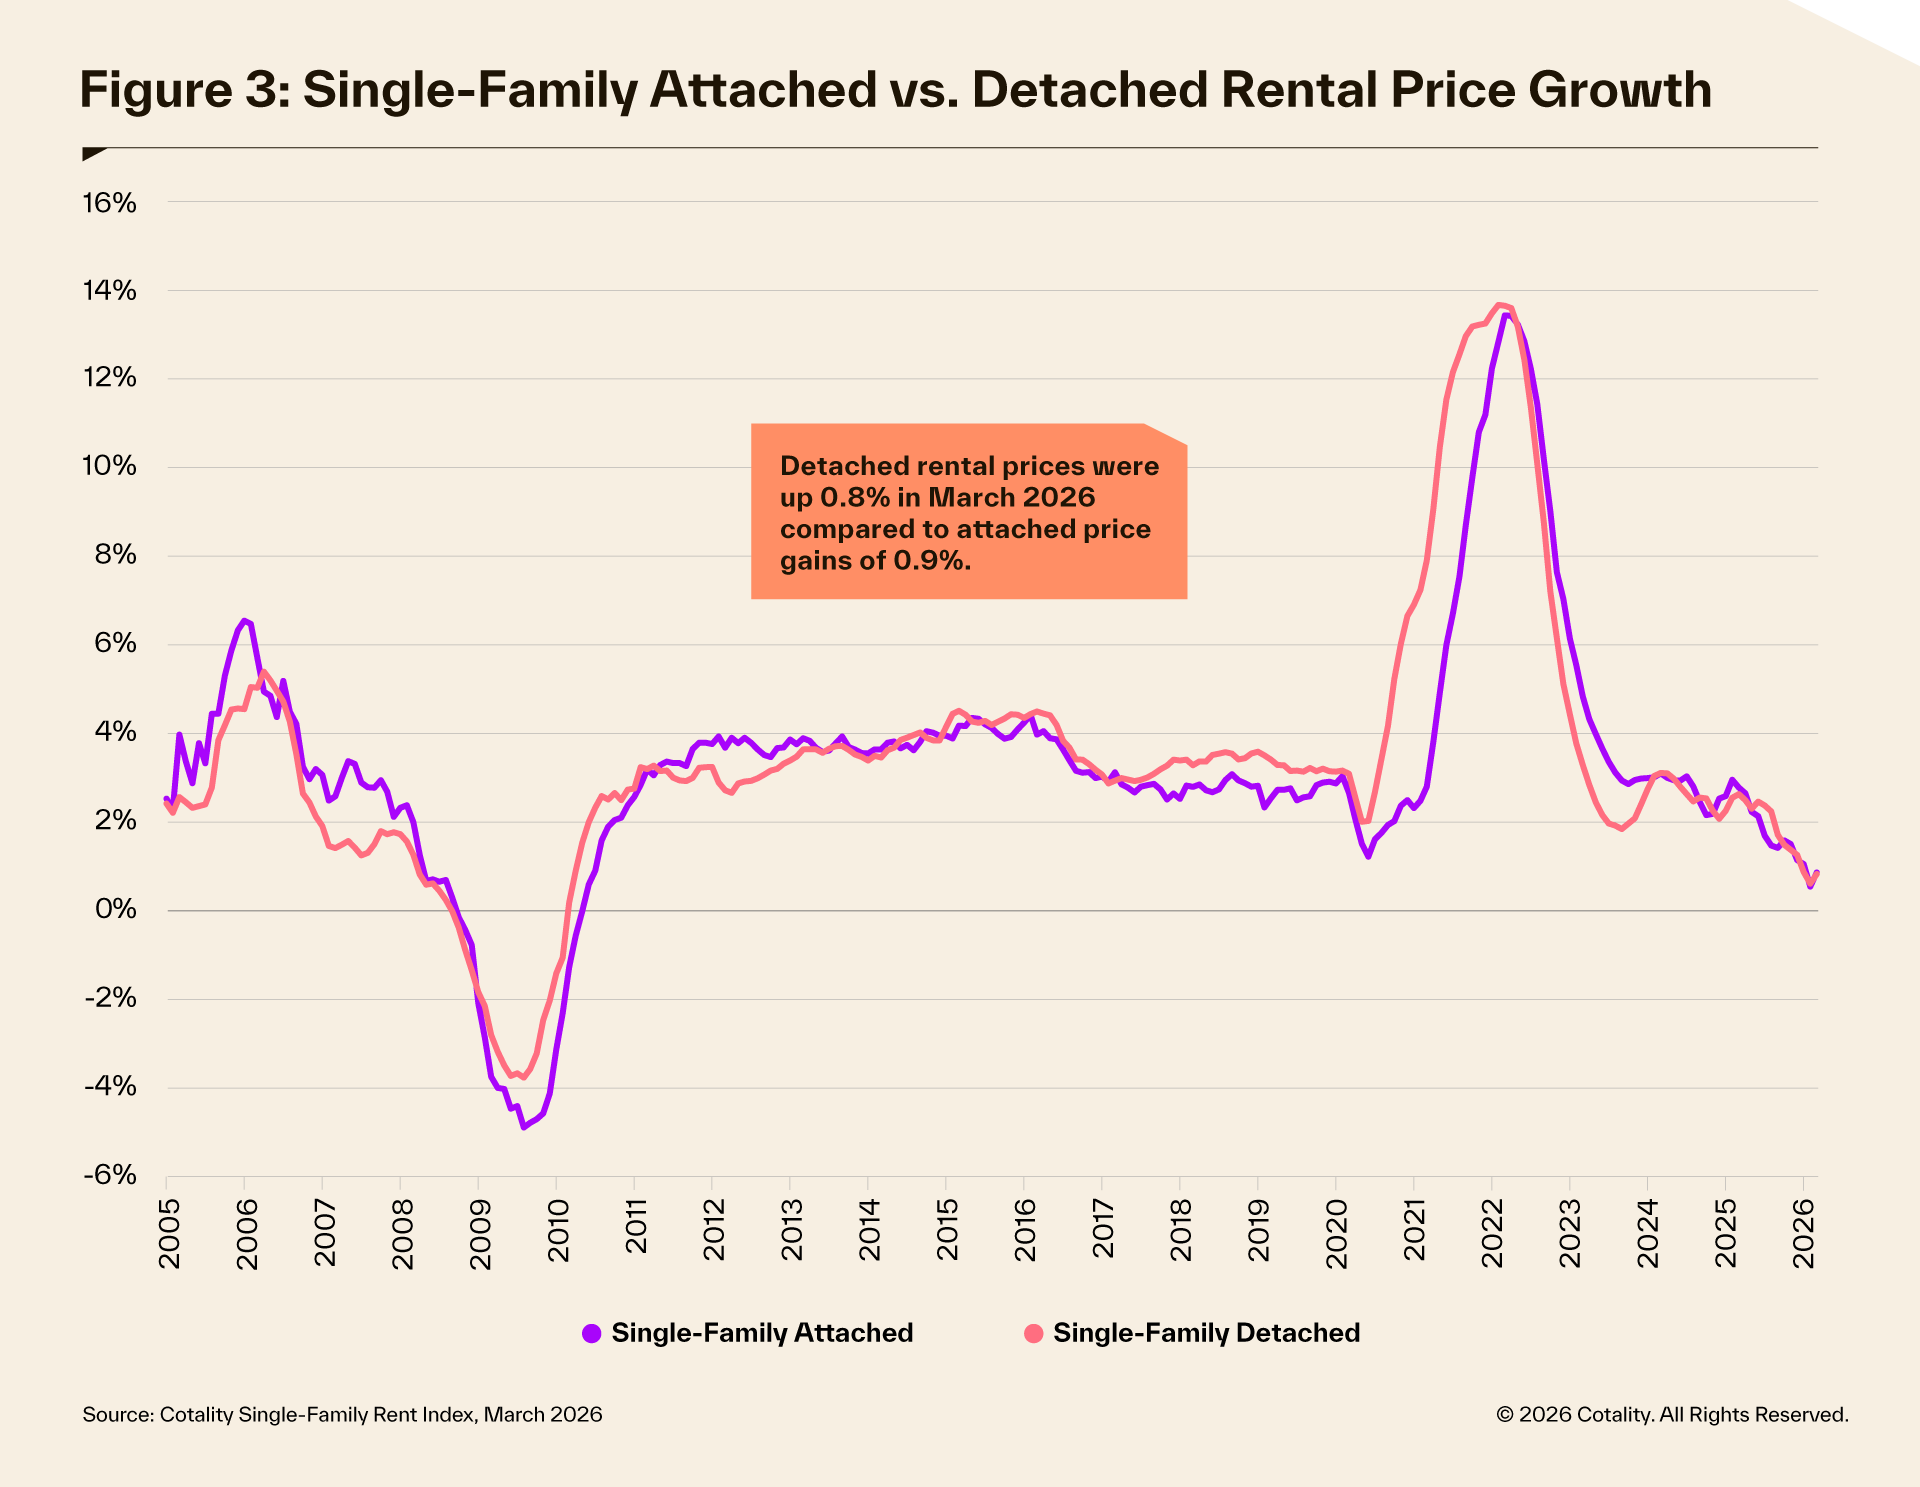
Rent for high-end properties increased 2.1% year over year in March 2026, a drop from the 3.2% gain recorded last year. Low-end property prices increased 0.7% year over year, a drop from a 2.1% gain in March 2025. Rent growth for detached rentals was once again 0.8% in March 2026, while it increased 0.9% for attached rentals.
From a monthly view, rent growth appears to be picking up. Rents increased at a slightly faster clip than the seasonal average, but there is significant variation between regions. Among the 10 largest metro areas, Chicago remained at the top of the list for the highest rent growth, at 4.9% in March 2026. Philadelphia is once again posting the second-highest rent growth at 4.7%, followed by New York (3.2%), Detroit (2.9%), and Atlanta (0.9%). Rent growth in Dallas and Houston, TX was essentially unchanged, with the major Texas metros posting 0.1% and 0.02% growth, respectively.
Outside of the major metros, there are clear pockets of deceleration. Florida once again topped the list, with 10 metros posting declines. Arizona had two. Los Angeles also saw a 1.2% decline in rents, which is a 7.1 percentage point change from the same time last year. However, that decline is an indication of stabilization following price hikes after the 2025 wildfires.
The next Cotality Single-Family Rent Index will be released on June 18, featuring data for April 2026. For ongoing housing trends and data, visit the Cotality Insights blog: www.cotality.com/insights.
Methodology
The Cotality Single-Family Rent Index (SFRI) applies a repeat pairing methodology to single-family rental listing data in the Multiple Listing Service. The rental listings used to calculate the index include both attached and detached single-family homes, as well as condominiums. This report shows trends for the U.S. and the 10 largest U.S. metropolitan areas. In addition to these 10 metros, the Cotality SFRI is available for close to 100 metropolitan areas —including approximately 50 metros with four value tiers — and a national composite index. The indices are fully revised with each release to signa turning points sooner.
The Cotality Single-Family Rent Index analyzes data across four price tiers: Lower-priced, which represent rentals with prices 75% or below the regional median; lower-middle, 75% to 100% of the regional median; higher-middle, 100%-125% of the regional median; and higher-priced, 125% or more above the regional median.
Median rent price data is produced monthly by Cotality Rental Trends. Rental Trends is built on a database of more than 11 million rental properties (over 75% of all U.S. individually owned rental properties)and covers all 50 states and 17,500 ZIP codes.
About Cotality
Cotality accelerates data, insights, and workflows across the property ecosystem to enable industry professionals to surpass their ambitions and impact society. With billions of real-time data signals across the life cycle of a property, we unearth hidden risks and transformative opportunities for agents, lenders, carriers, and innovators. Get to know us at www.cotality.com.
Media Contact
Charity Head
Cotality