


2026 Cotality Severe Convective Storm Risk Report
Imagine two hypothetical Oklahoma homeowners: Mark and Sarah.
Mark and Sarah have maintained their property and paid their insurance premiums for the decade since they bought their home. They thought they were prepared to weather any storm, but when a severe weather event pelted their roof with 3-inch hail, that sense of security vanished. Because field representatives were spread thin across the storm-impacted area, Mark and Sarah’s recovery stalled.
A three-week delay in claims adjustment followed—but the weather didn’t wait. During that time, it rained three times, causing a roof leak that evolved into a total-loss mold infestation. What should have been a $20,000 roof repair spiraled into a $120,000 full-gut renovation, displacing their family for six months and exhausting their coverage.
To make matters worse, when it came time to renew their policy, Mark and Sarah learned that their premiums, along with those of their neighbors, were rising.
This fictional scenario is based on a costly reality many homeowners have experienced. As severe convective storm (SCS) events—such as hail, tornadoes, and straight-line winds—become the primary drivers of annual insured losses, a family’s ability to return home depends on a high-stakes professional relay.
Resilience is no longer just a matter of individual preparation; it is a multi-stage defense where the success of each phase, from accurate risk pricing to physical restoration, is vital.
The recovery ecosystem: A unified defense
The transition of SCS from a secondary concern to a primary threat has placed unprecedented strain on the recovery ecosystem. When a storm hits, the resilience of a community depends not on a single entity, but on a chain of professionals:
- Underwriters: use structure-level data and insights for effective risk selection and pricing to ensure recovery funding is always available.
- Catastrophe (Cat) Risk modelers: identify high-risk concentrations allowing for strategic resource allocation and portfolio balancing.
- Claims reps: verify weather events, impacting how fast a family can start the recovery process.
- Restoration contractors: turn insurance payouts into reality using modern materials and workflows to rebuild.
Cotality’s 2026 Severe Convective Storm Report highlights the changing SCS landscape and why each of these four essential groups must function in harmony to help homes and communities recover as quickly as possible.


Underwriting
Insurers can no longer rely on historical weather patterns to predict future losses.
Hail damage risk
SCS activity explains some of claim volatility and variance plaguing insurers, but not all. Since hail is one of the most prominent drivers of property insurance claims today, an underwriting solution that relies heavily on historical hazard data or averaged regional estimates leaves portfolios exposed to unaccounted risk factors. These factors, often caused by the structures on the ground, can significantly amplify or reduce claims.
For example, in many areas, the average age of roofs is increasing. An aged roof is more brittle and susceptible to failure during a hail event compared to a newer installation, effectively amplifying the claim. Combining storm simulations with building characteristics, such as roof age, type, or condition, allows us to move past reactive historical snapshots to a forward-looking view of claim behavior.
Cotality estimated the number of and total reconstruction cost value (RCV) of homes at risk to hail damage at the metro and state levels. Texas leads all states in risk due to its size, geographic position relative to SCS activity and housing concentrations.
Number of homes at moderate or greater risk to hail damage by state
Figure 1 data source: Cotality, 2026
Across the country, over 43.5 million properties—approximately 42% of all analyzed properties—fall into moderate or greater hail risk categories. This represents a staggering $17.8 trillion in reconstruction cost value (RCV), which is the estimated cost to rebuild should these homes be declared a total loss.
Top 10 states by number of homes and associated RCV with moderate or greater risk to hail damage
Tabel 1 data source: Cotality, 2026
Texas leads the nation with nearly 8 million properties and $3.1 trillion in exposed RCV. However, Figure 1 reveals a compelling insight: Illinois is a hidden giant, ranking second with $1.5 trillion in exposed RCV. While it lacks the frequent, extreme hail risk found in states like Colorado or Kansas, Illinois holds a larger volume of expensive properties with moderate-to-high risk.
Top 10 metropolitan areas by number of homes and associated RCV with moderate or greater risk to hail damage
Table 2 data source: Cotality, 2026
When we drill down into the metro-level data, this dynamic creates what we call the "Chicago Anomaly." Because the greater Chicago area is so densely packed with high-value real estate, its aggregate RCV actually surpasses Dallas-Fort Worth as the most financially exposed metro area in the country, with $1.0 trillion in RCV at risk.
Despite Chicago taking the top metro spot, the Texas triangle—comprising Dallas-Fort Worth, Houston, Austin, and San Antonio—continues to dominate, combining for over $2.2 trillion in exposed RCV.
Beyond Texas, the data also highlights a heavy Midwest footprint; secondary markets like Minneapolis, St.Louis, Kansas City, and Denver sit dangerously close to major weather collision zones, making them frequent targets for severe spring and summer storms.
Tornado and straight-line wind risk
Tornado and straight-line winds also present significant threats to property. Cotality estimates that over 76 million homes (with a combined RCV of over $27 trillion) face moderate or greater risk from EF0 tornadoes. Additionally, over 64 million homes, representing $23 trillion in RCV, are at moderate or greater risk from winds of 65 mph or higher.
Catastrophe Risk
Broad averages and outdated assumptions can blindside insurers to extreme tail risks.
As severe hail becomes a primary driver of catastrophic loss—rivaling the financial impact of a Category 4 hurricane—catastrophe models must serve as a highly precise map and compass for risk modelers.
From a reinsurance perspective, capturing the true volatility of these massive $30 billion tail events is critical. It ensures that treaty negotiations, retention limits, and capital reserves are precisely calibrated so that the entire risk-transfer ecosystem remains solvent.
The hail-driven tail event
Could a single hailstorm rival the financial impact of a Category 4 hurricane? In 2026, the answer is a definitive yes.
Comparing the US hail and all-perils occurrence exceedance probability (OEP) losses for various return periods
Figure 2 data source: Cotality, 2026
Figure 2 illustrates a paradigm shift in extreme weather risk: a single hailstorm can now generate catastrophic financial losses similar to a major hurricane.
Historically, SCS were labeled "secondary perils"—high-frequency but low-severity events. However, the data shows this is no longer the case.
At the 500-year return period (representing the rarest, most extreme events), the modeled "all perils" loss reaches $71 billion. Strikingly, a single extreme hailstorm alone accounts for $58 billion of that total. This trend remains consistent even at more frequent 50-year intervals, where a single hail event can still generate nearly $30 billion in insured losses.
Case study: The June 2023 Texas storm cluster
Consider the massive June 2023 Texas storm cluster.
From June 11 to June 15, hail greater than 1 inch affected more than 680,000 residential homes. Cotality estimated these storms caused between $7 to $10 billion in insured losses, 95% of which were due to hail.
Comparing the storm footprint of the June 2023 Texas storm cluster with an alternate hypothetical scenario 15 to 20 miles north
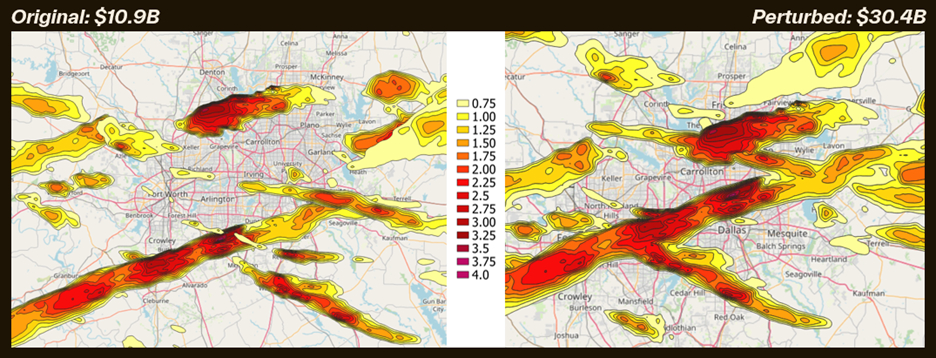
Figure 3 data source: Cotality 2026
But what happens if that exact same storm footprint—identical intensity and duration—shifts just 15 to 20 miles north into the heart of the Fort Worth metropolitan area?
The insured loss escalates from approximately $11 billion to $30 billion; a mere 20-mile shift results in a roughly $19 billion difference in potential claims.
When major hailstones intersect with a densely populated urban core, the result is a $30 billion catastrophe on par with a major landfalling hurricane.
Claims
Fast, accurate weather verification is a critical pivot point between a storm’s impact and a family’s recovery.
A single severe convective storm can damage thousands of homes in a single afternoon. A claims team's ability to verify these events and activate resources determines how quickly homeowners can return to their lives.
Proactive response requires granular data that identifies exactly where damaging hail fell, allowing adjusters to anticipate resource needs before the initial First Notice of Loss (FNOL) is even filed.
Over the course of 2025, Cotality Weather Verify™ estimated that damaging hail (2-inches or greater) impacted more than 600,000 single- and multifamily homes in the contiguous U.S. The combined RCV of these properties reached $177 billion.
Damaging hail fell on Texas more than all other states over the last year, with more than 235,000 homes impacted. The highest-volume states included:
- Texas: 235,000+ homes
- Wyoming: 41,000+ homes
- Oklahoma, Wisconsin, and Kansas: 38,000+ homes each
Combined, these five states accounted for approximately 66% of all U.S. homes impacted by damaging hail in 2025.
Top 10 states by number of homes impacted by 2-inch hail or greater in 2025
Table 3 data source: Cotality, 2026
Two-inch hail—roughly the size of a hen's egg—possesses the mass and terminal velocity to cause significant property damage. Beyond shattering windows, skylights, and siding, these impacts can compromise the structural integrity of roofing systems.
Large hail can also impact electrical infrastructure, triggering power outages that complicate emergency responses and delay initial recovery efforts.
The annual number of days with 2-inch hail or greater
Figure 4 data source: Cotality, 2026
Cotality Weather Verify™ captured 142 days of damaging hail across the U.S. last year. This represents an increase of seven days relative to 2024, and surpasses the 20-year average of 122 days.
Restoration
Modern storm outbreaks cause complex, multi-layered damage that cannot be repaired in silos.
Contractors in the restoration industry are seeing a shift toward high-severity, localized SCS outbreak events—intense, single-day hailstorms that can compromise entire neighborhoods simultaneously.
The average revenue and project complexity per job is increasing, while overall volume has become more episodic and geographically concentrated.
Cross-divisional workflow impact
Data from Cotality DASH™ indicates that SCS events trigger a cascade of workflows across multiple service lines within a restoration contractor's business:
- Emergency services (EMS): Rapid stabilization via board-ups, roof tarping, and debris removal to mitigate loss during the critical early-response period.
- Water mitigation: Addressing wind-driven rain and structural breaches through extraction and drying to prevent secondary damage and protect rebuild timelines.
- Contents and cleaning: Coordinating pack-outs and restoration when interior exposure extends beyond surface-level damage.
- Reconstruction: Managing structural and exterior rebuilds, often dictated by material availability and labor capacity during regional surge conditions.
1. Heavy reconstruction and exterior trades
The most immediate consequence of hail, straight-line winds, and tornadoes is severe exterior structural damage:
- Roofing and siding: High-velocity winds and large hail strip shingles, dent metal roofs, and rip off siding.
- Windows and doors: Impact from flying debris and large-diameter hail frequently shatters standard glazing, leading to immediate surges in replacement demand.
- Soffit, fascia, and gutters: Wind and hail often damage roofline drainage systems. While these are sometimes viewed as minor components, their damage can significantly increase the repair scope and contribute to water intrusion.
- General reconstruction: Catastrophic outbreaks, such as EF-rated tornadoes, require full structural rebuilding rather than localized cosmetic repairs.
In response to the frequency and severity of these exterior losses, many restoration firms have expanded into specialized exterior trades. This vertical integration allows firms to control the entire project lifecycle, protect profit margins, and ensure a more seamless customer experience.
2. The rise of "appraisal and consulting"
As the financial severity of SCS events escalates—driven by inflation, rising material costs, and complex property designs—insurance claims have become far more scrutinized.
Restoration contractors are increasingly stepping into consulting and appraisal roles to provide independent quantification, forensic data analysis, and engineering insights.
This ensures that the true cost of reconstruction—including mandatory upgrades to meet modern, wind-resistant building codes—is accurately captured in the claim. By clarifying documentation early, contractors aim to minimize supplement frequency, resolve engineering disputes, and accelerate the overall review timeline.
3. Cross-divisional water mitigation
While SCS is primarily categorized as a wind and hail peril, it serves as a massive driver for water mitigation divisions. When a severe convective storm compromises a building envelope (e.g., tearing off roof decking or shattering windows), it exposes the interior to wind-driven rain.
This transforms a standard exterior repair into a complex interior mitigation project. Often, this work must begin before the full claim is approved to prevent mold or further structural rot, increasing the short-term financial exposure for contractors.
4. Phased project timelines
Unlike a localized event like a pipe burst, SCS jobs tend to have highly phased, prolonged timelines. Because these “storm outbreaks” impact thousands of homes in a single metropolitan area simultaneously, supply chain bottlenecks and labor shortages frequently extend the lifecycle of these jobs from weeks to months.
International: A global threat to recovery ecosystems
The threat of SCS is not a uniquely American phenomenon. While the geographic scale and meteorological triggers in the U.S. command significant global attention, international insurance and restoration ecosystems are facing similar challenges. These global outbreaks consistently test the limits of local recovery networks and supply chains.
Total SCS-related economic losses by year in EU (Billions EUR)
Figure 5 data source: European Commission, Disaster Risk Management Knowledge Centre, Disaster losses and damages Dashboard, fields “Derecho”, “Hail”, “Severe weather”, “Storm (general)”, “Tornado”, “Lightning/Thunderstorms”
Total SCS-related economic losses by country for 2000-2024 in EU (Billions EUR)
Figure 6 data source: European Commission, Disaster Risk Management Knowledge Centre, Disaster losses and damages Dashboard, fields “Derecho”, “Hail”, “Severe weather”, “Storm (general)”, “Tornado”, “Lightning/Thunderstorms”
Among EU member states, Germany recorded the highest absolute economic losses from SCS between 2000 and 2024, totaling 12.3 billion EUR. However, when accounting for population size, Ireland sustained the highest per capita loss rate.
Case study: The 2023 July supercells over southeast Europe
The vulnerability of the global recovery ecosystem was putto the ultimate test in mid-July 2023, when two consecutive days of devastating convective storms battered southeastern Europe.
On July 19, a Mesoscale Convective System generated severe winds, heavy precipitation, and large hail as it tracked eastward at speeds exceeding 80 km/h. Moving from Northern Italy through Slovenia, Croatia, and Serbia, the system became particularly violent over Croatia.
It produced wind speeds of 115 km/h at the Zagreb airport, while in eastern Croatia, wind gusts in Gradište reached a staggering 180 km/h.
The sheer force of the storm left a swath of destruction, including:
- Structural damage: Severe impact on roofs and facades caused by hail measuring up to 13 cm (nearly 5 inches) in Karlovac.
- Infrastructure failure: Widespread power outages due to fallen trees and collapsed electrical grids.
- Flash flooding: Intense localized flooding triggered by 20–35 mm of rainfall occurring in just 10 minutes in Zagreb.
The strain on the local recovery chain was immediate and overwhelming. Because the storm crossed multiple international borders in less than 12 hours, it challenged the phased project timelines of several national restoration markets simultaneously.
"The atmosphere does not recognize geographic borders, and neither do systemic challenges of storm recovery," said Cotality Chief Scientist Howard Botts. "The multi-stage defense required to rebuild a community, from precise underwriting to rapid physical restoration, is universally dependent on granular data and synchronized response."
A unified defense
From the property exposure hidden in the 'Chicago Anomaly' to the devastating, fast-moving July supercells that left a swath of destruction across Southeast Europe, severe convective storms test every link in the recovery ecosystem.
While the professional ecosystem provides the structural framework for recovery, true resilience is ultimately built from the ground up by empowering policy holders to adopt tangible loss mitigation measures. To make properties more resilient against severe convective storms and hail specifically, homeowners should focus on fortifying the exterior building envelope:
- Upgrade to storm-resistant building materials: Replacing outdated or fragile elements with modern, storm-resistant building materials is the primary first line of defense.
- Build to wind-resistant codes: Updating older structures to comply with modern wind-resistant building codes ensures properties are equipped to withstand intense pressures of severe straight-line winds and tornadoes.
- Install class-4, impact-resistant shingles: These specialized shingles are rigorously tested to endure large-diameter hail, drastically reducing the probability of roof penetration.
- Secure windows and skylights: Installing impact-resistant glazing or permanent storm shutters prevents hail from shattering glass, which keeps wind-driven rain from destroying the interior.
- Protect exterior HVAC units: Adding hail guards or protective steel grates over exterior mechanical equipment can prevent costly denting and destruction of heating and cooling systems.
To effectively manage the escalating threat of severe convective storms, the industry must rely on a synchronized response across the entire recovery ecosystem.
When underwriters accurately price property-level vulnerabilities and catastrophe modelers effectively map extreme tail risks, the necessary capital is secured before a storm strikes. Following an event, precise weather verification allows claims teams to immediately deploy resources, enabling restoration professionals to execute complex rebuilds without delay.
Integrating data-driven insights at every phase of this unified defense ensures the industry can efficiently manage catastrophic outbreaks—and communities are built back stronger, as quickly as possible.
