


Major earthquake hazard risk update materially impacts portfolios


Overview
Cotality analyzed the impact of the newly released USGS National Seismic Hazard Model 2023 (NSHM23), and Cotality implementation of the model shows that the impact to earthquake insurance writers’ risk assessment decisions may be monumental. Changes to portfolio losses could reveal major opportunities tore-optimize and rebalance holdings.

In January 2024, the United States Geological Survey (USGS) released a nationwide update to its National Seismic Hazard Model (NSHM) (USGS NSHM 2023) to build upon the previous version released in 2020 (USGS NSHM 2018). The NSHM is a primary seismic hazard data source in fully probabilistic, catastrophe models (CAT models) used in the (re)insurance industry to quantify portfolio-level earthquake risk.
Cotality partnered with the California Earthquake Authority (CEA) to incorporate this updated hazard model into our Navigate SaaS catastrophe model and Risk Quantification and Engineering (RQE™) offering to understand how the updated NSHM would change modeled earthquake risk in California (RQE v25). The results were compared to the current RQE v24 version of the Cotality U.S. Earthquake model. The NSHM 2018 release incorporates the most current versions of the earthquake seismic risk and USGS hazard models not used in other catastrophe model vendor solutions.
At this time, the only variable change analyzed in this study was the seismic hazard. There were no alterations to vulnerability or financial components of the model.
The results showed not only material changes to key modeling metrics, including portfolio-level Average Annual Loss (AAL) and Return Period (RP) losses, but a high degree of spatial variability. Within a single ZIP code, a difference of only a few miles from a fault resulted in material increases and decreases in losses . The new hazard model update on risk assessment will have material impact at the individual property level.
How the updated NSHM could change your workflows
We can clearly see the changes to damage in loss in two California: the Bay Area (NorCal) and the greater Los Angeles area (SoCal) (Figure 1). The geographic distribution of modeled insured values is presented in Figure 2.
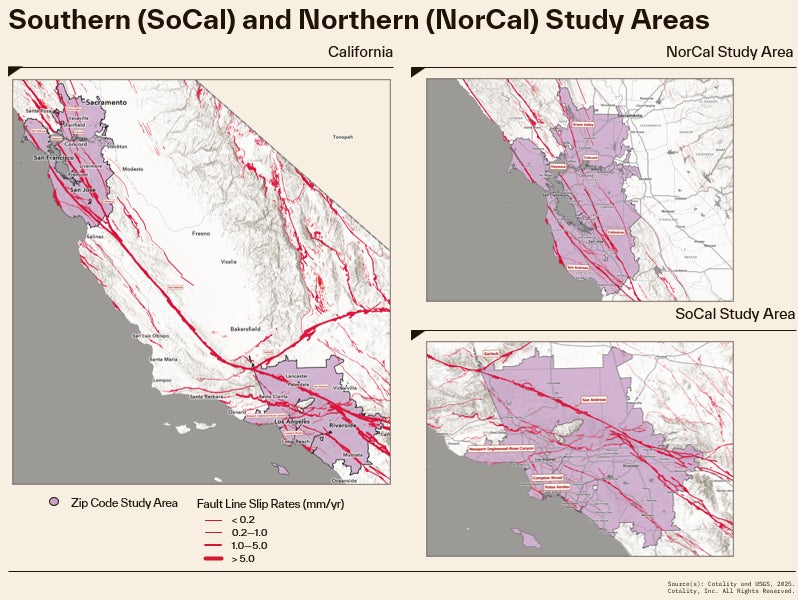
Data source: Cotality and USGS, 2025
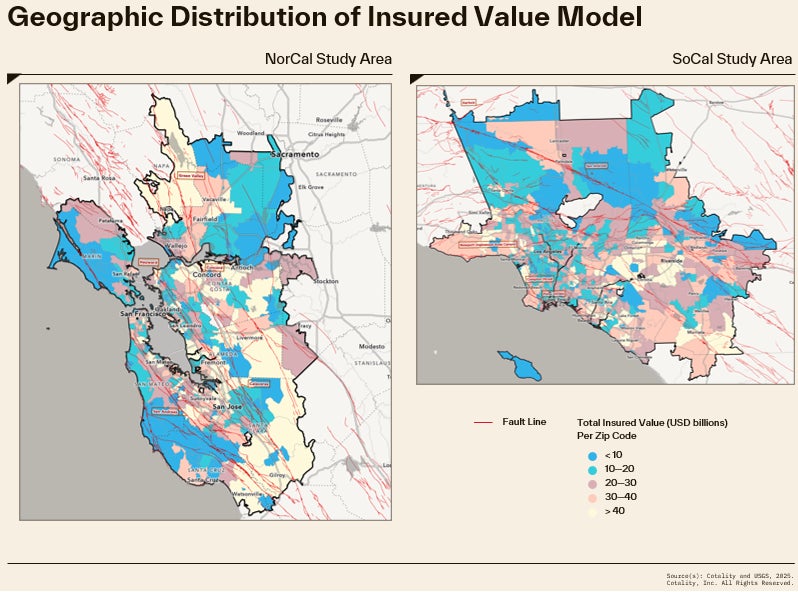
Data source: Cotality, 2025
The modeled time dependent ground-up damage and gross loss changes from RQE v24 and RQE v25 are material in each region (Figure 3). This demonstrates the significance that this updated hazard model may have on any carrier’s individual portfolio, depending on the spatial distribution of exposure.
Modeled Ground-Up Damage and Gross AAL and select occurrence return period loss percent changes between RQE v24 (NSHM 2018) and RQE v25 (NSHM 2023) in the NorCal (red) and SoCal (dark blue) regions
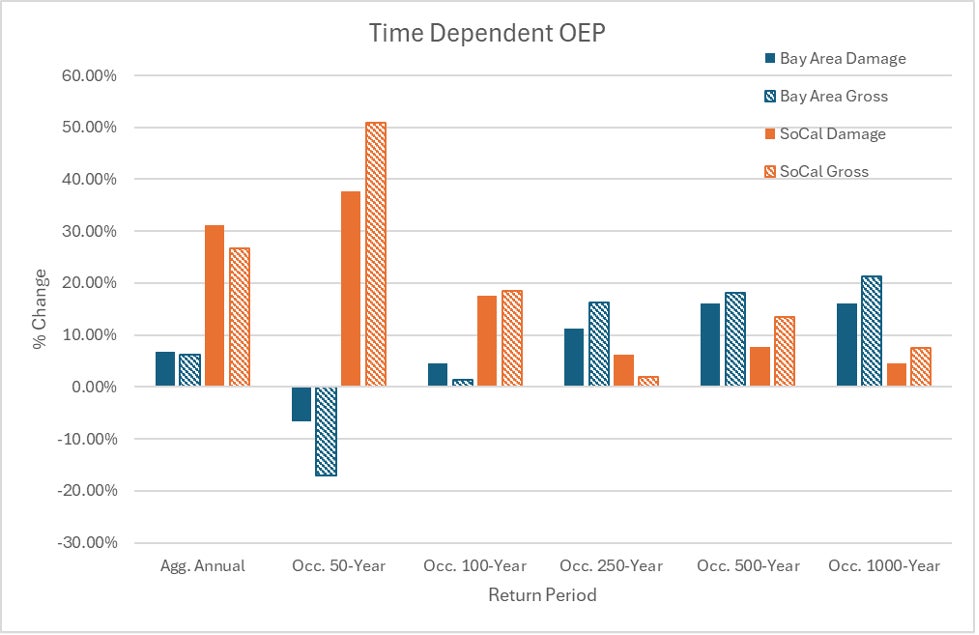
Source: Cotality, 2025
Bay Area study region: Cotality observed decreases in the 50-year RP damage and loss with the new hazard update. Both damage and gross loss increased from the 100-year RP through the tail of the risk (typically up to 20% increases in both the ground up damage and gross loss).
SoCal study region: Cotality identified significant increases in the 50- and 100-year RP ground up damages and gross losses with the new hazard update. The 250-year and above RP changes were notable but less drastic. The average annual loss (AAL) exhibits an increase of +31% in the 50- to 100-year observation period and +26% in the 250-year observation period for ground-up damage and gross loss.
Granularity of change
Seismic risk has often been incorrectly considered a low-resolution peril with little differentiation in hazard risk over miles. But there is significant local nuance.
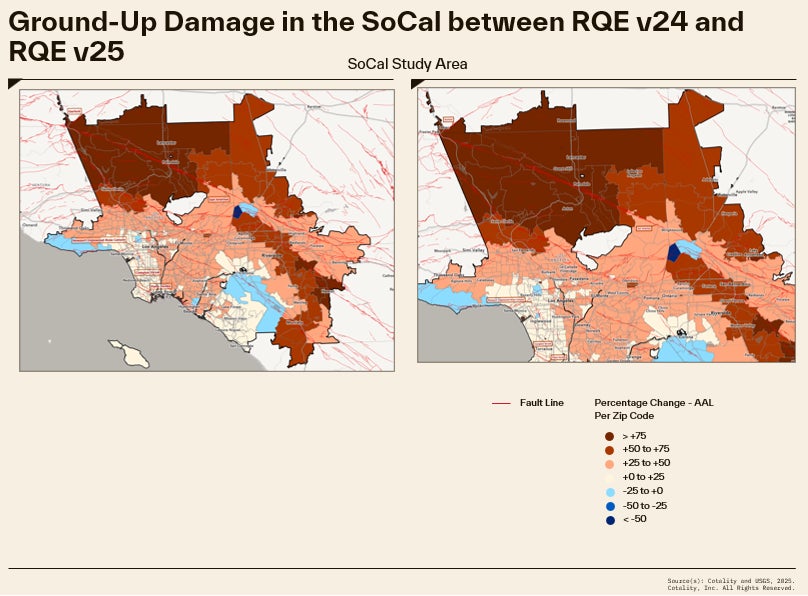
A great example of this higher resolution analysis (Figure 4 and Figure 5) shows both increases and decreases in loss over ZIP Codes within close proximity. The figures show the location of major fault lines, and where changes in the treatment of how these fault lines are captured in the latest hazard model, there are granular changes in loss.
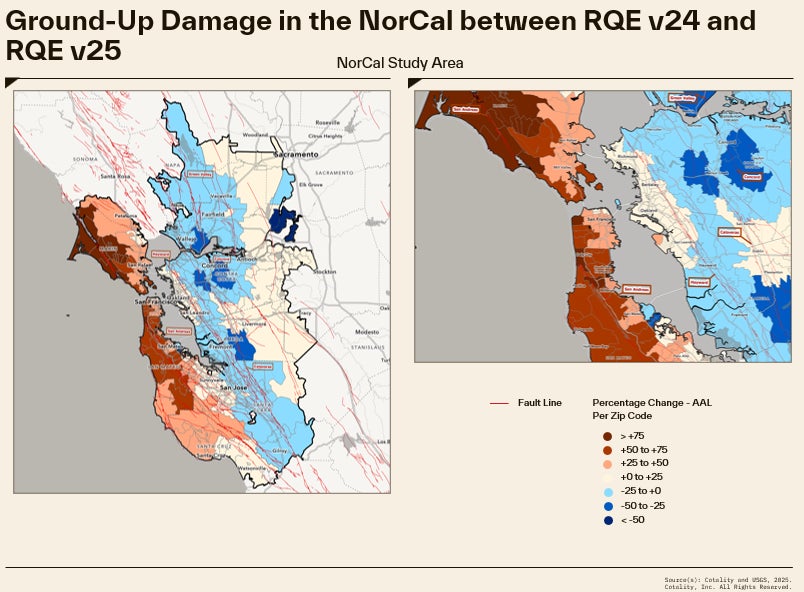
Source: Cotality, 2025
In the NorCal study region, elevated time dependent rates along the San Andreas Fault make the area the dominant contributor to average annual loss in the area. Along the Hayward Fault, time dependent rates declined by approximately 20%. This decline is largely due to the USGS’s revised moment balancing which decreased long-term recurrence rates along portions of the Hayward fault and other faults in the East Bay. This new view of risk shows a shift in the relative AAL contributions and an overall reduction in absolute AAL values associated with the Hayward Fault.
Source: Cotality, 2025
Observed differences in the SoCal study region are the result of a complex network of fault sources. Among these, the south section of the San Andreas fault stands out as one of the major contributors. Beyond what is shown in the figure, the San Diego area further south also shows a notable increase in AAL, largely driven by increased rates along the Rose Canyon fault system.
The updated hazard model may have significant implications for earthquake insurance underwriting, portfolio optimization and reinsurance. Exposure distribution will play a major role in how NSHM23 updates will impact the loss changes to the portfolios. Figure 4 shows that portfolios with high exposures in San Francisco may see large increases whereas portfolios with a more significant presence only a few miles away in Oakland may see substantial decreases.
Cotality is your guide through change
The new model was released in July 2025, and Cotality has been the only catastrophe model vendor to stay up to date with the last two USGS releases. We’re here to support any clients who wish to understand the magnitude of this change their individual portfolio. Connect with us on a consulting basis, or via Navigate, our SaaS Cat modeling on demand solution. For more information, please reach out to your Cotality client success manager or email hazardrisk@Cotality.com.