


Press Release
U.S. home equity dips further this fall


- The average U.S. homeowner lost approximately $13,400 in equity during the past year, but that still leaves the average borrower with about $299,000 in accumulated home equity.
- Total homeowner equity for borrowers with a mortgage totaled $17.1 trillion in the third quarter of 2025.
- The number of homes in negative equity increased year over year by 21% to 1.2 million homes.
IRVINE, Calif., December 11, 2025 — Cotality, a leading global property information, analytics and data-enabled solutions provider, today released the Homeowner Equity Report (HER) for the third quarter of 2025. The report reveals a mixed picture of homeowner equity gains across the United States.
Borrower equity decreased year over year, declining by $373.8 billion or 2.1%. That decline translates to an overall net equity to $17.1 trillion for homes with a mortgage. Homeowner equity peaked at close to $17.7 trillion in the second quarter of 2024 and has since oscillated between $17 trillion and $17.6 trillion.
"As the pace of home price growth slows and markets recalibrate from pandemic peaks, we’re seeing a clear shift in equity trends,” said Cotality Chief Economist Dr. Selma Hepp. “Negative equity is on the rise, driven in part by affordability challenges that have led many first-time and lower-income buyers to over-leverage through piggyback loans or minimal down payments. While overall home equity remains elevated, recent purchasers with smaller down payments may now face negative equity.”
Homeowners should pay attention to the moderating market. After gaining $25,000 in 2023 and another $4,900 in 2024, recent equity gains have stalled. Year over year, homeowners across the U.S. lost an average of $13,400 in equity. While many homeowners are still flush with stored home equity, recent quarterly declines reflect home price corrections in some markets coupled with higher levels of equity extractions and buyers who bought homes with lower down payments.
As a result, loan-to-value (LTVs) ratios have shifted higher. There has been a particular increase in the share of homeowners with 85% to 94% LTVs.
While the share of homeowners in negative equity reduced in the second quarter of this year, it ticked up again in the third quarter. In the current quarter, 2.2% of homeowners have negative equity or 1.2 million properties. Another way to think about it is that there’s been a 21% year-over-year rise in the number of homeowners in negative equity with 216,000 more homes falling into the category in the third quarter, a trend that has been gaining steam and signals possible market difficulties ahead.
Compared to the second quarter, there has been a 6.7% increase in the number of mortgaged residential properties sitting in negative equity. This slide in equity tracks with market cycles as the spring homebuying season faded into the slower fall market, during which period there’s a more consistent weakness in home price gains across markets.
However, that share is unlikely to change much over the next year. Current data shows that 168,000 properties would regain equity if home prices rose 5%, but 319,000 would fall into negative equity if prices fall 5%. However, the Cotality Home Price Index is forecast to increase by just over 4% by October 2026.
The future performance of highly leveraged loans will hinge on the strength of the U.S. economy and labor market. Even as expectations for continued price appreciation and economic resilience persist, it remains critical to closely monitor these loans in the months ahead," continued Hepp.
Homeowners in the Northeast continue to amass equity as regional home prices continue to outpace many other areas in the U.S. Connecticut ($31.5K), New Jersey ($27.5K), and Rhode Island ($16.2K) saw the largest gains year over year. However, those gains were smaller than last quarter. In contrast, 32 states posted annual equity losses. The top three states to lose equity were Florida ($-37.4K), the District of Columbia ($-35.5K), and California ($-32.5K).
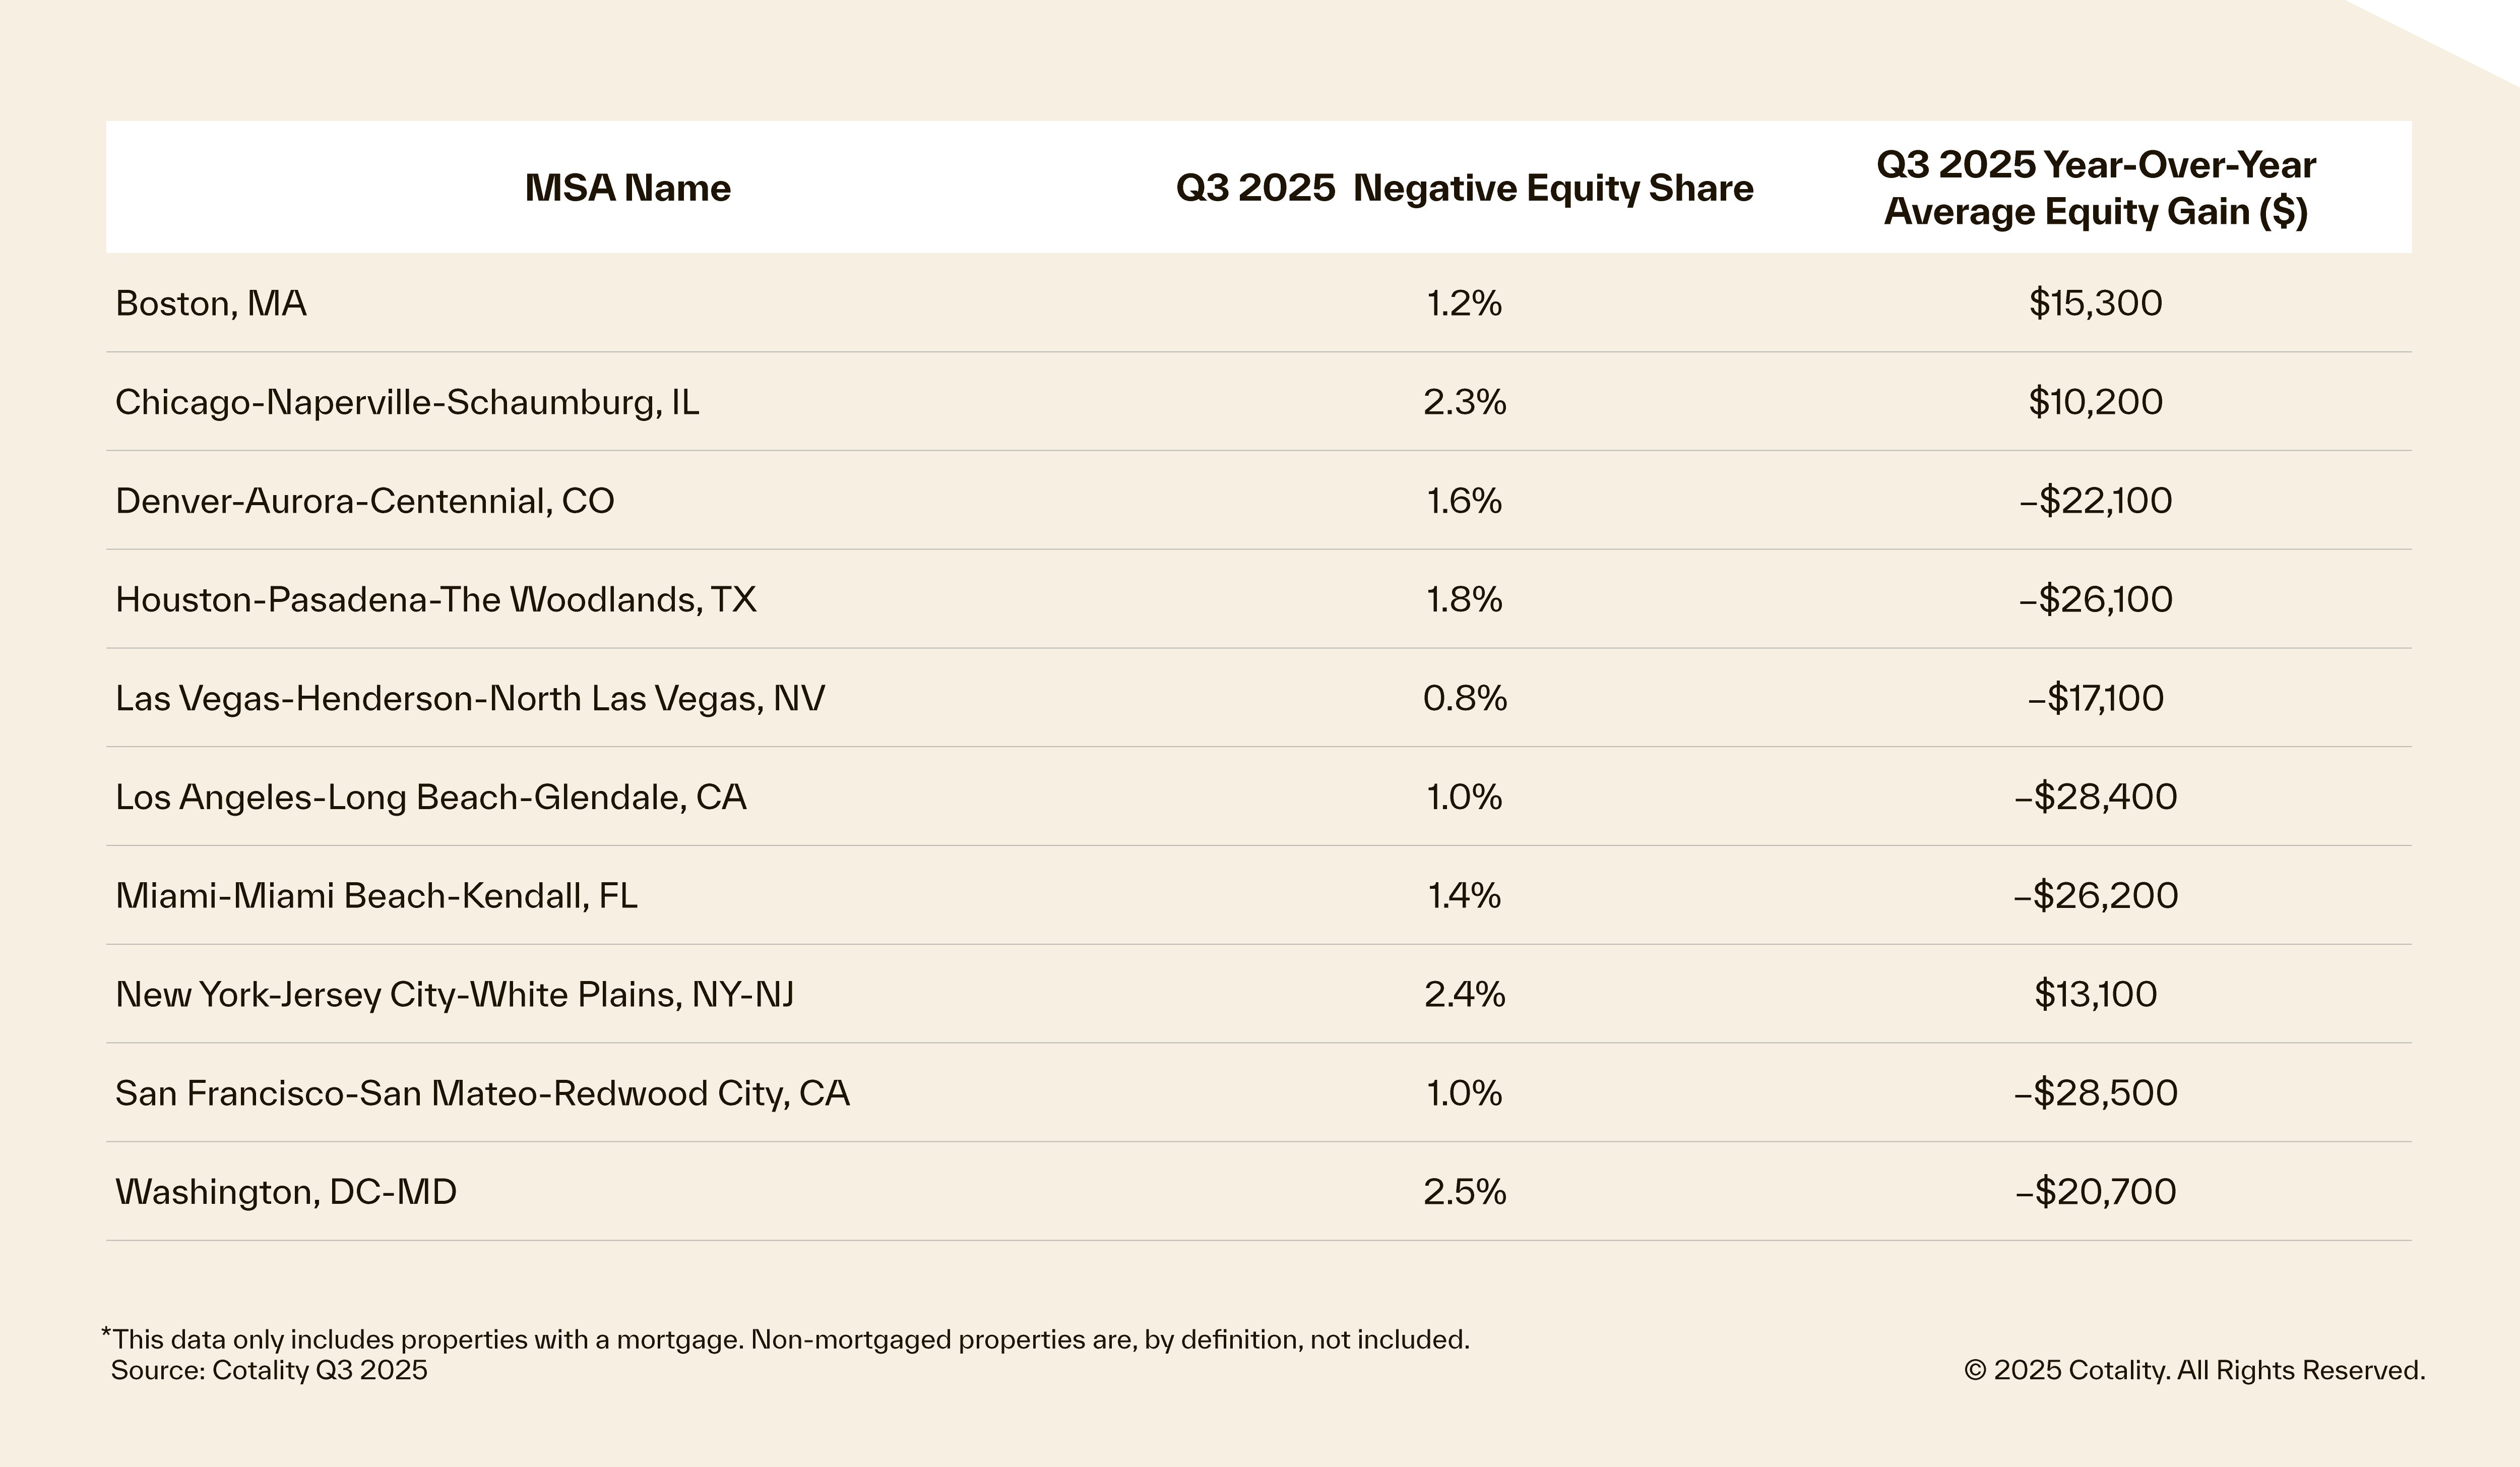
Cotality provides homeowner equity data at the metropolitan level. In Table 1, 10 of the largest cities, by housing stock, are depicted. While negative equity has seen an increase nationally, Las Vegas, NV; Los Angeles and San Francisco are the least challenged. Markets that have seen large increases in negative equity shares include Austin, TX; Baton Rouge, LA; New Orleans, LA; and Lafayette, LA — all areas where home prices have fallen or natural disasters have whittled away borrowers’ equity.
The next Cotality Homeowner Equity Report will be released March 5, 2026, featuring data for Q4 2025. For ongoing housing trends and data, visit the Cotality Insights Blog: www.cotality.com/insights.
Figure 1: Map of average year-over-year equity gain per borrower
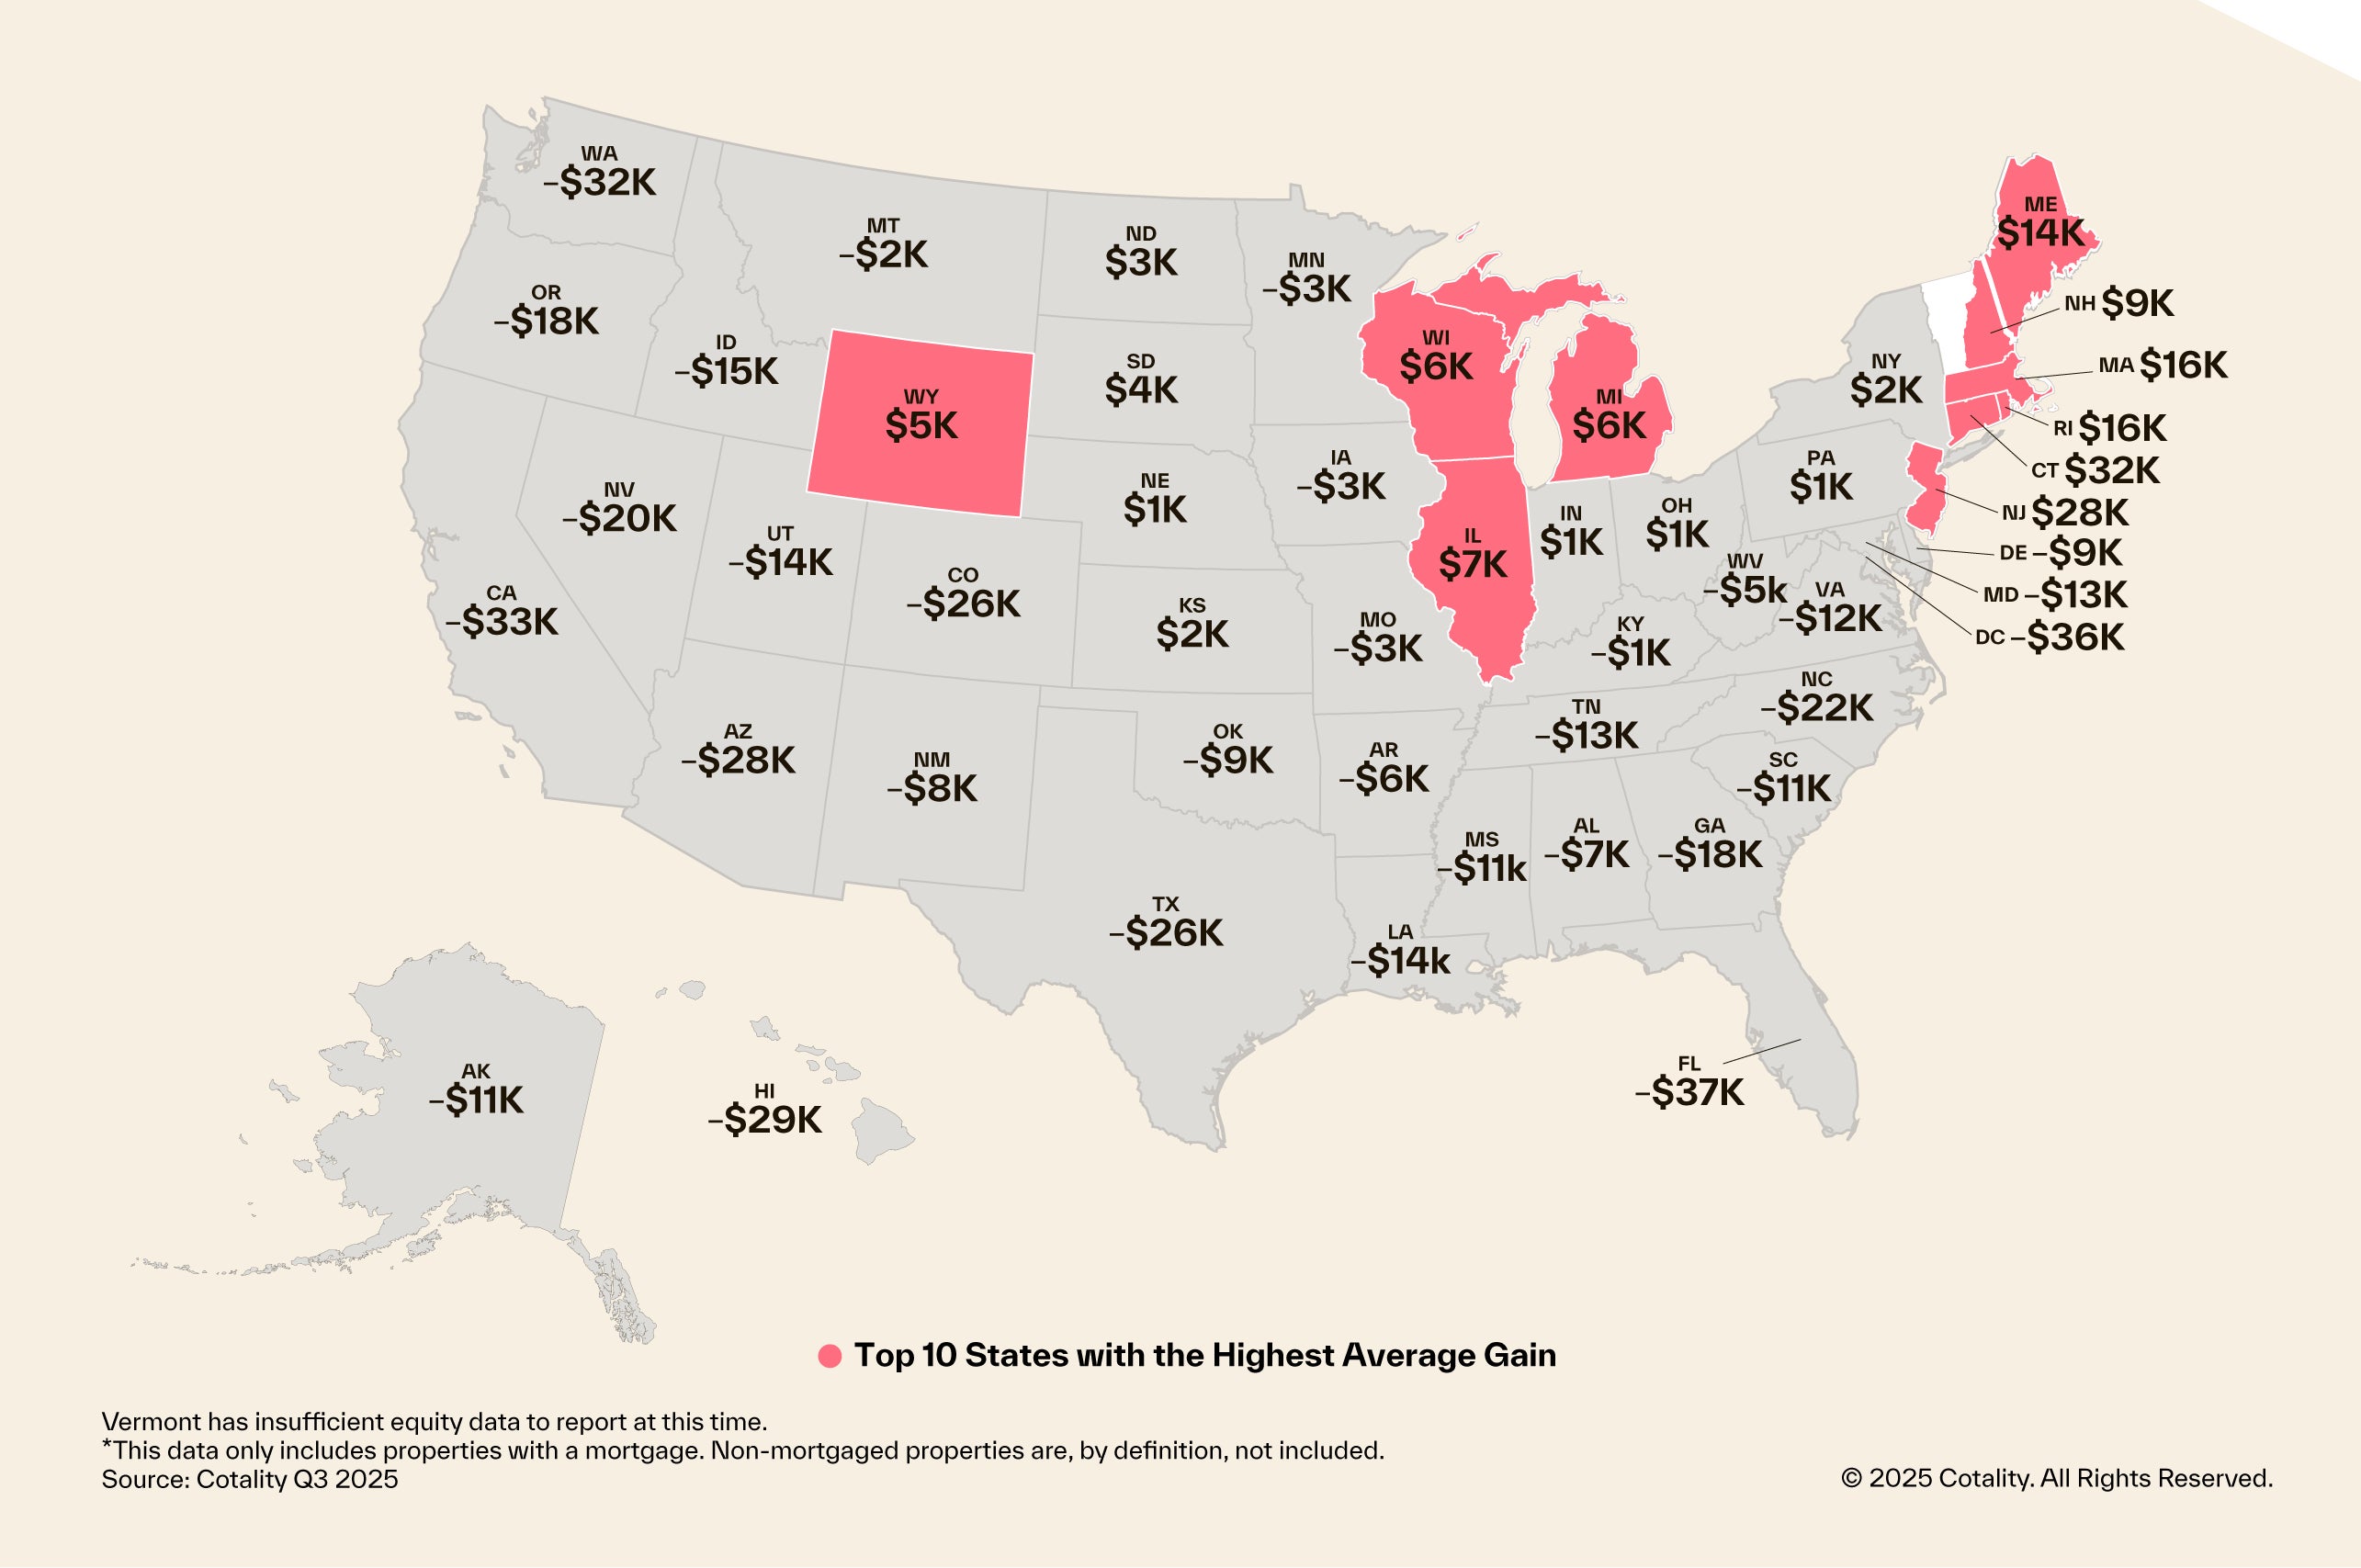
Figure 2: National home equity distribution by LTV segment
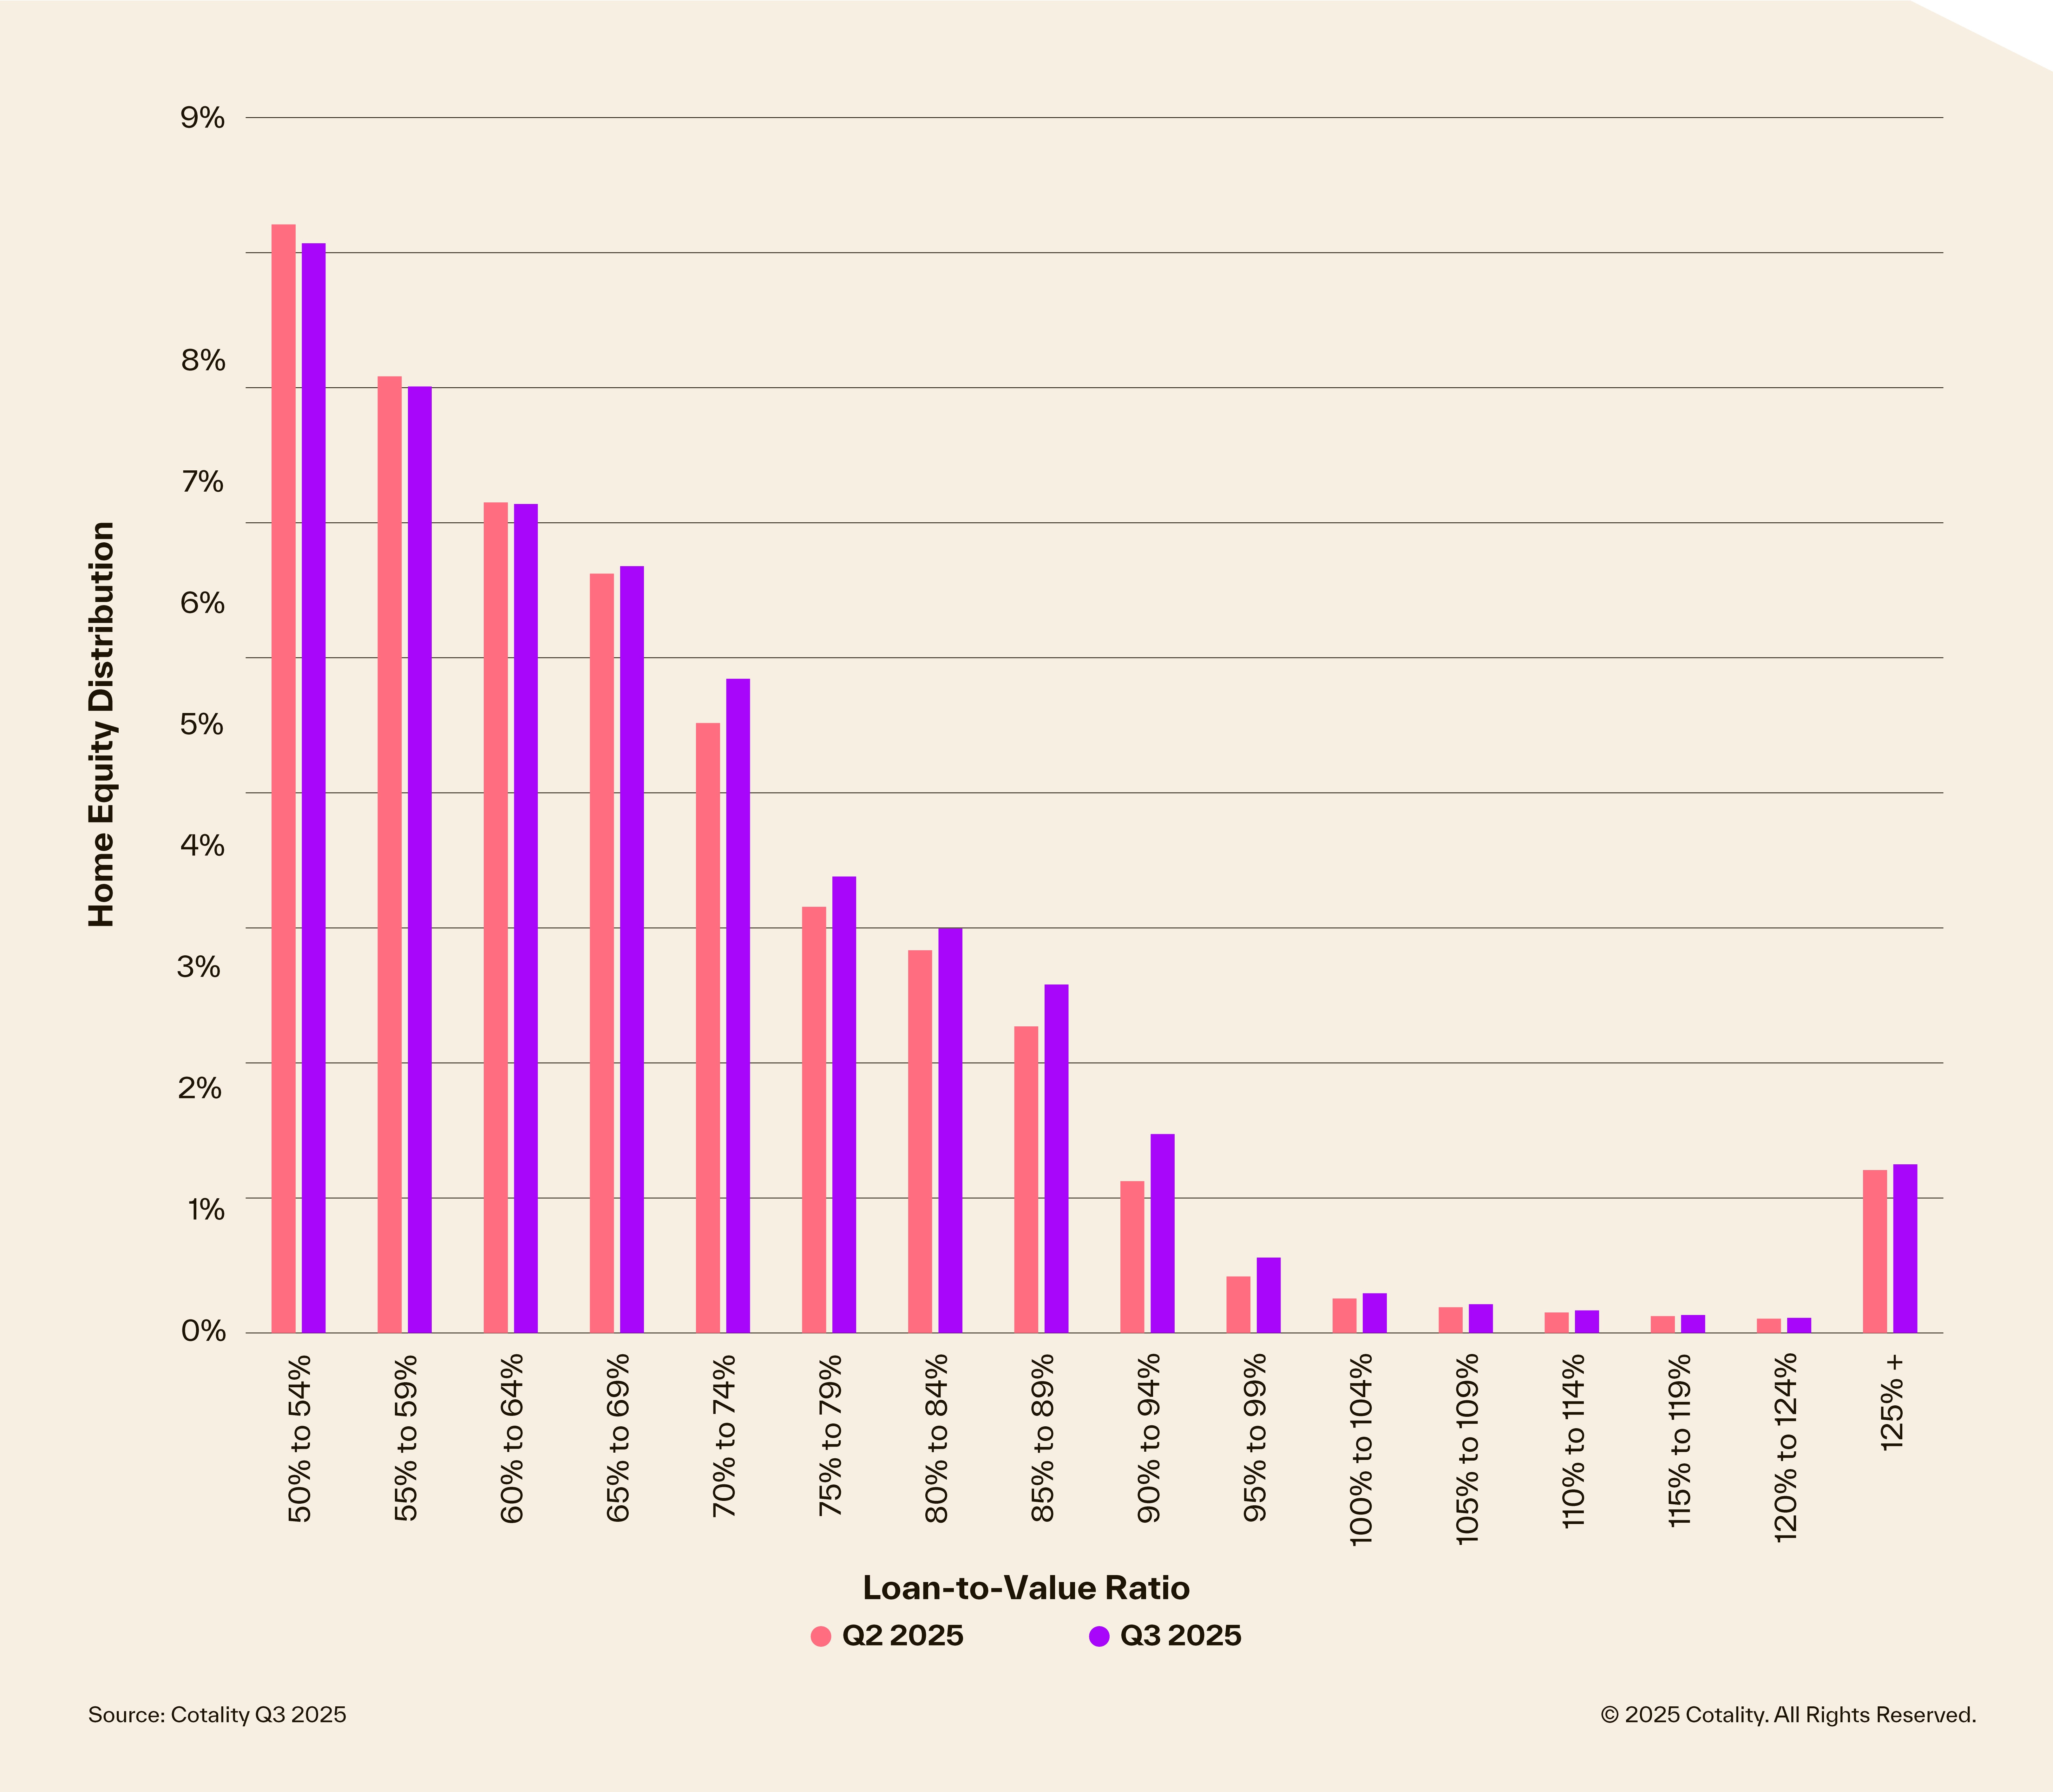
Table 1: Negative equity share for select metropolitan areas
Methodology
The amount of equity for each property is determined by comparing the estimated current value of the property against the mortgage debt outstanding (MDO). If the MDO is greater than the estimated value, then the property is determined to be in a negative equity position. If the estimated value is greater than the MDO, then the property is determined to be in a positive equity position. The data is first generated at the property level and aggregated to higher levels of geography. Cotality uses public record data as the source of the MDO, which includes more than 50 million first- and second mortgage liens and is adjusted for amortization and home equity utilization in order to capture the true level of MDO for each property. Only data for mortgaged residential properties that have a current estimated value are included. There are several states or jurisdictions where the public record, current value or mortgage data coverage is thin and have been excluded from the analysis. These instances account for fewer than 5% of the total U.S. population. The percentage of homeowners with a mortgage is from the 2019 American Community Survey. Data for the previous quarter was revised. Revisions with public records data are standard, and to ensure accuracy, Cotality incorporates the newly released public data to provide updated results.
Source: Cotality
The data provided is for use only by the primary recipient or the primary recipient’s publication or broadcast. This data may not be resold, republished, or licensed to any other source, including publications and sources owned by the primary recipient’s parent company, without prior written permission from Cotality. Any Cotality data used for publication or broadcast, in whole or in part, must be sourced as coming from Cotality, a data and analytics company. For use with broadcast or web content, the citation must directly accompany the first reference of the data. If the data is illustrated with maps, charts, graphs, or other visual elements, the Cotality logo must be included on screen or website. For questions, analysis, or interpretation of the data, contact newsmedia@cotality.com. Data provided may not be modified without the prior written permission of Cotality. Do not use the data in any unlawful manner.
About Cotality
Cotality accelerates data, insights, and workflows across the property ecosystem to enable industry professionals to surpass their ambitions and impact society. With billions of real-time data signals across the life cycle of a property, we unearth hidden risks and transformative opportunities for agents, lenders, carriers, and innovators. Get to know us at www.cotality.com.
Media Contact
Charity Head
Cotality