


Press Release
May YOY Price Appreciation Decelerates Again, Up 2.3%


The end of the spring homebuying season was characterized by softer home prices, the exception being the Northeast and Midwest where seasonal price gains align with pre-pandemic trends.
IRVINE, Calif., July 29, 2025 — Persistently high mortgage rates and economic uncertainty led to a 2025 homebuying season defined by low activity. Potential buyers seem weighted down by concerns around financial stability, policy uncertainty, and job security.
Despite inventory increases that tilted many markets in favor of buyers, dampened homebuying demand resulted in overall weak sales activity. Similarly, there are muted sales expectations for the rest of the year.
Growth in for-sale inventories was a bright spot that signaled the lock-in effect may be starting to unlock. However, many sellers who listed their homes owned them outright and/or were likely facing surging non-fixed costs, such as insurance and property taxes, which makes it significantly more expensive to hold on to the properties.
Another notable change was the deceleration in home price appreciation, which expanded affordability options for certain purchasers. In May, S&P Case-Shiller Index rose 2.3%, continuing the slowing trend in price increases that started in 2024. At the beginning of 2024, home price growth peaked at 6.5% (Figure 1).
Slowing home price appreciation is likely to continue. The latest Cotality Home Price Index showed annual growth at only 1.8% in May. When adjusted for inflation, the Case-Shiller home price index is down to 0.7% year over year.
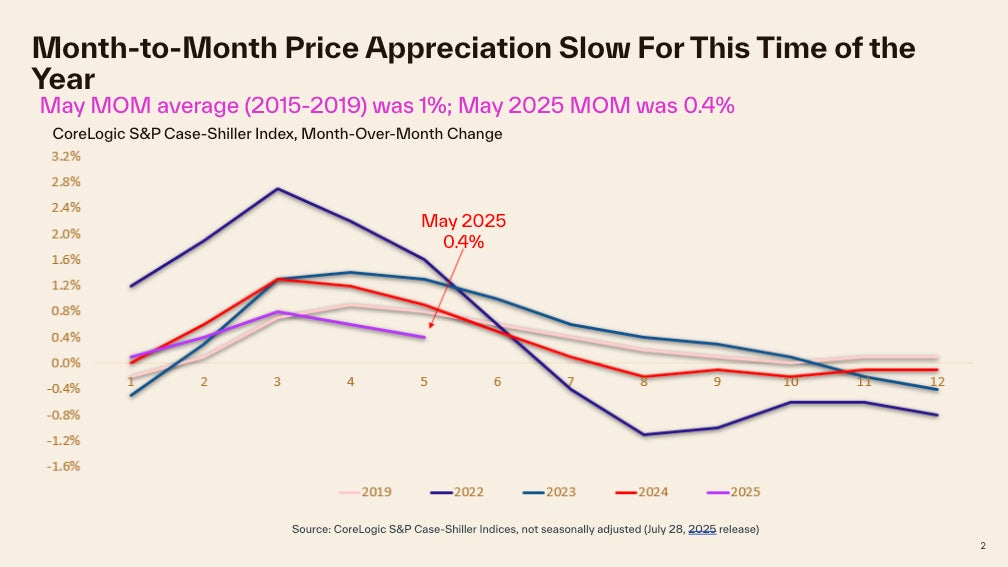
The non-seasonally adjusted, month-over-month index recorded a 0.5% increase in May, following two months of relatively faster gains. The monthly change is below the average 1% increase recorded between 2015 and 2019 for May (Figure 2). Slower than seasonal gains were also reported in Cotality’s Home Price Index this past May. Gains came in at half the pace than seen pre-pandemic. Mortgage rates did surge again in April, notably slowing homebuying demand and removing some price pressure that had been building in the lead up to the spring homebuying season.
The 10-city and 20-city composite indexes also slowed in May, with annual growth at 3.4% and 2.8%, respectively. This is down from the March 2024 peak when the 10-city composite index recorded 8.3% growth, and the 20-city composite recorded 7.5% growth.
Compared with the 2006 peak, the national index is 79% higher, the 10-city composite index is 60% higher, and the 20-city composite 66% higher. Adjusted for inflation, the 10-city index is now 7% higher than its 2006 level, while the 20-city index is up by 11% when compared with its 2006 high point. When adjusted for inflation, national home prices are 20% higher compared with 2006. Inflation-adjusted prices haven’t shown the same level of appreciation as nominal prices given elevated inflation in recent years.
“Home price increases slowed in May, with inflation-adjusted rates indicating little to no growth. While the early spring homebuying season did see some seasonal activity, demand decreased after April and led to smaller home price increases in May,” said Cotality’s Chief Economist Dr. Selma Hepp. “Los Angeles had a significant effect on the overall index, with the region’s slower growth following the wildfires contributing to these results. In contrast, markets in the Northeast and Midwest — such as New York, Cleveland, Boston, Minneapolis, Chicago, and Detroit — benefitted from relative affordability and continued to see strong demand. These areas followed seasonal trends similar to those observed before the pandemic.”
Figure 1
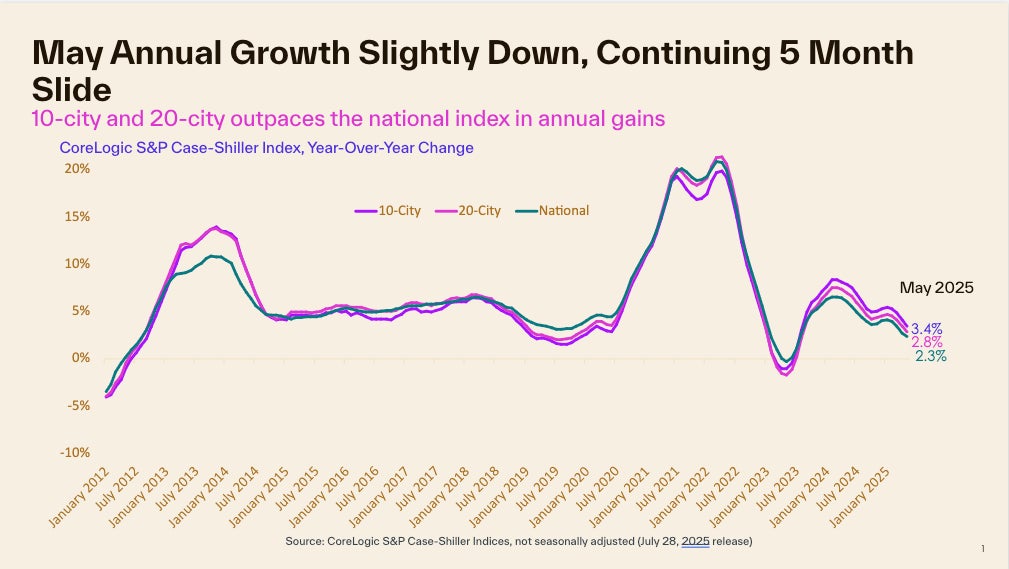
Figure 2
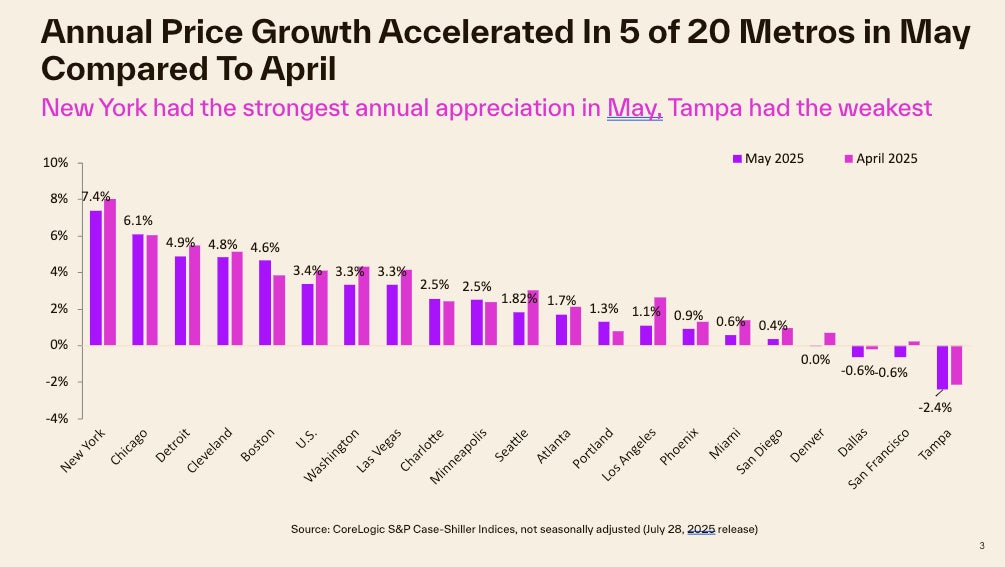
In May, 15 of the 20 metros saw slowing price growth year over year compared with the previous month (Figure 3). Los Angeles posted the largest cooldown in annual gains compared with the month before. It was followed by Seattle and Washington. The relaxing of Los Angeles’ price pressures reflects slowing demand pressures following the January wildfires. Demand for rentals and for purchase properties, particularly in higher-priced segments, surged following the fires, but this quickly reversed over the course of the spring. In contrast, eight metros saw annual gains accelerate from the month before, led by Boston and Portland.
New York, Chicago, and Detroit continued to lead the 20-city index annual gains, with respective increases of 7.4%, 6.1%, and 4.9%. Ten metros saw annual price gains higher than the national 2.3% increase. Tampa, Florida remained the slowest market in the 20-city index and was the only one recording an annual decline at -2.4%.
Figure 3
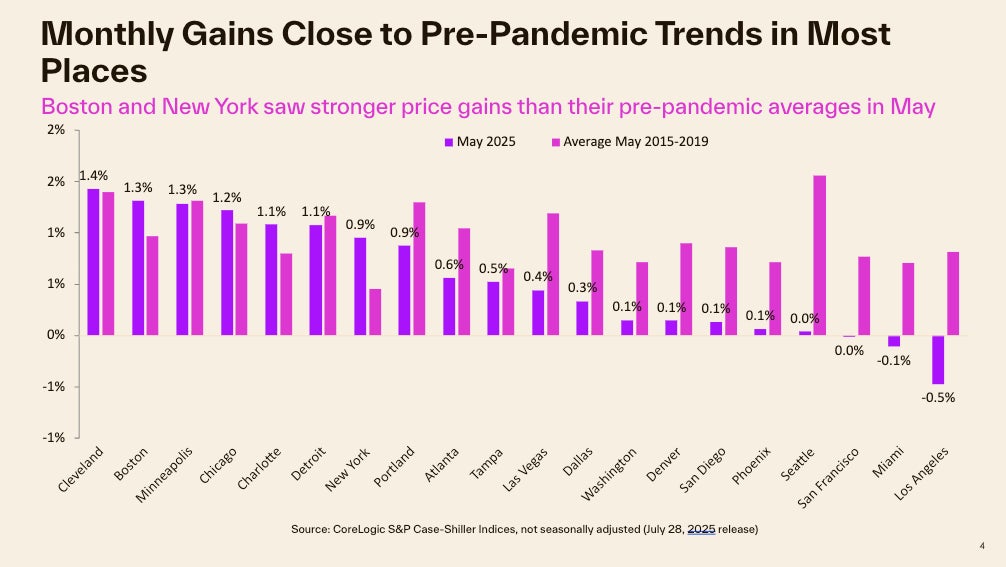
Compared to April, national home prices recorded increases that were weaker than pre-pandemic, up 0.5% in May. This is less than the 1% month-over-month increase generally seen in May. The weakness mostly resulted from a 0.5% decline in Los Angeles, which is weighted heavily in the Case-Shiller Index due to its size. Miami and San Francisco also posted monthly price losses. In contrast, many markets in the Northeast and Midwest that have seen persistently strong home price gains continued to fare well in May. Cleveland, Boston, Minneapolis, Chicago, Charlotte, Detroit, and New York all recorded May gains consistent with pre-pandemic trends. New York continues to be one of the strongest performing markets where both monthly gains and the annual rate of growth remain above trend.
Figure 4 summarizes the current year’s monthly changes in May compared with averages recorded between 2015 and 2019.
Figure 4
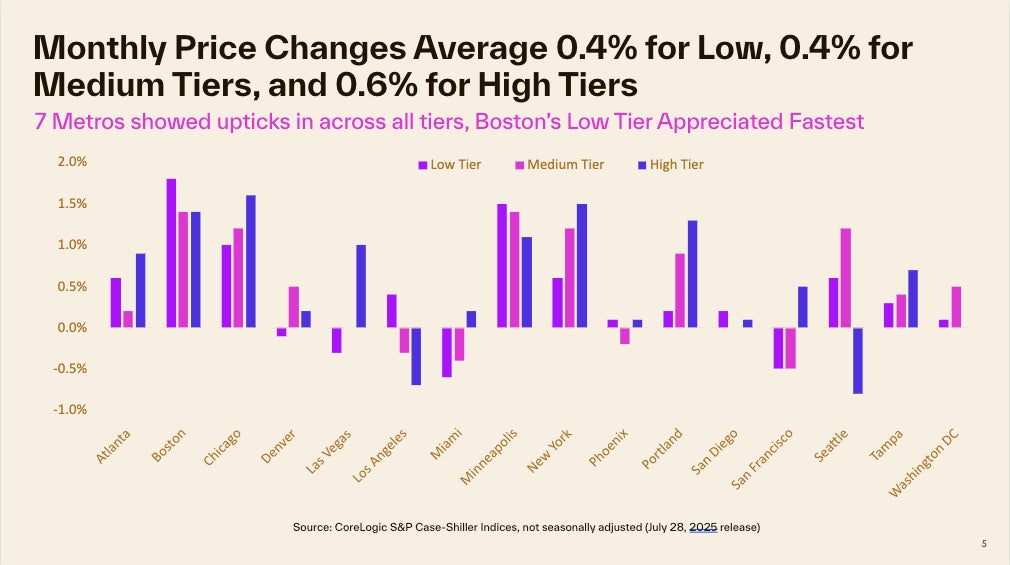
The month-over-month comparison of appreciation by price tier and location also reveals relative differences in demand across the country. In May, home prices were generally up across metros and price tiers. The exceptions were Los Angeles, Seattle, and Miami. However, the most notable declines were in the higher-priced tiers of Seattle and Los Angeles, which could reflect a retraction in demand following the wildfires.
High-tier prices jumped 0.6% on average across metros while the middle tier increased 0.4%. The low tier had an average increase of 0.4%. Strong gains in the high tier were pushed up by significant gains in upper-tier pricing of homes in Chicago, New York, and Portland (Figure 5).
Figure 5
This spring proved to be interesting. Many markets experienced an increase in for-sale inventory, but most buyers did not enter the market despite signs of their rising interest. Higher housing costs, rather than inventory levels, are now currently the primary factor limiting home sales activity. Increases in inventory are contributing to more balanced conditions between buyers and sellers, potentially improving buyers' positions after several challenging spring seasons. As economic conditions and uncertainties related to current administration policies become clearer, buyer participation may increase.