Press Release
June Year-Over-Year Home Price Appreciation Slows to 1.9%
The S&P Cotality Case-Shiller Home Price Index was previously known as the S&P CoreLogic Case-Shiller Home Price Index and is a leading measure of U.S. residential real estate prices.
IRVINE, Calif., August 26, 2025 — Summer started sluggish for the housing market. Persistently high mortgage rates, historically low inventory, and broader macroeconomic uncertainty weighed on both buyers and sellers. Sellers remain hesitant to list due to elevated interest rates while buyers are cautious amid concerns over job security.
Even as inventory increases in some areas, the reluctance of buyers to bid and buy could lead to price declines if external pressures force sellers to act. With no clear path to balance buyer and seller needs, both sales and prices are expected to remain subdued through year-end.
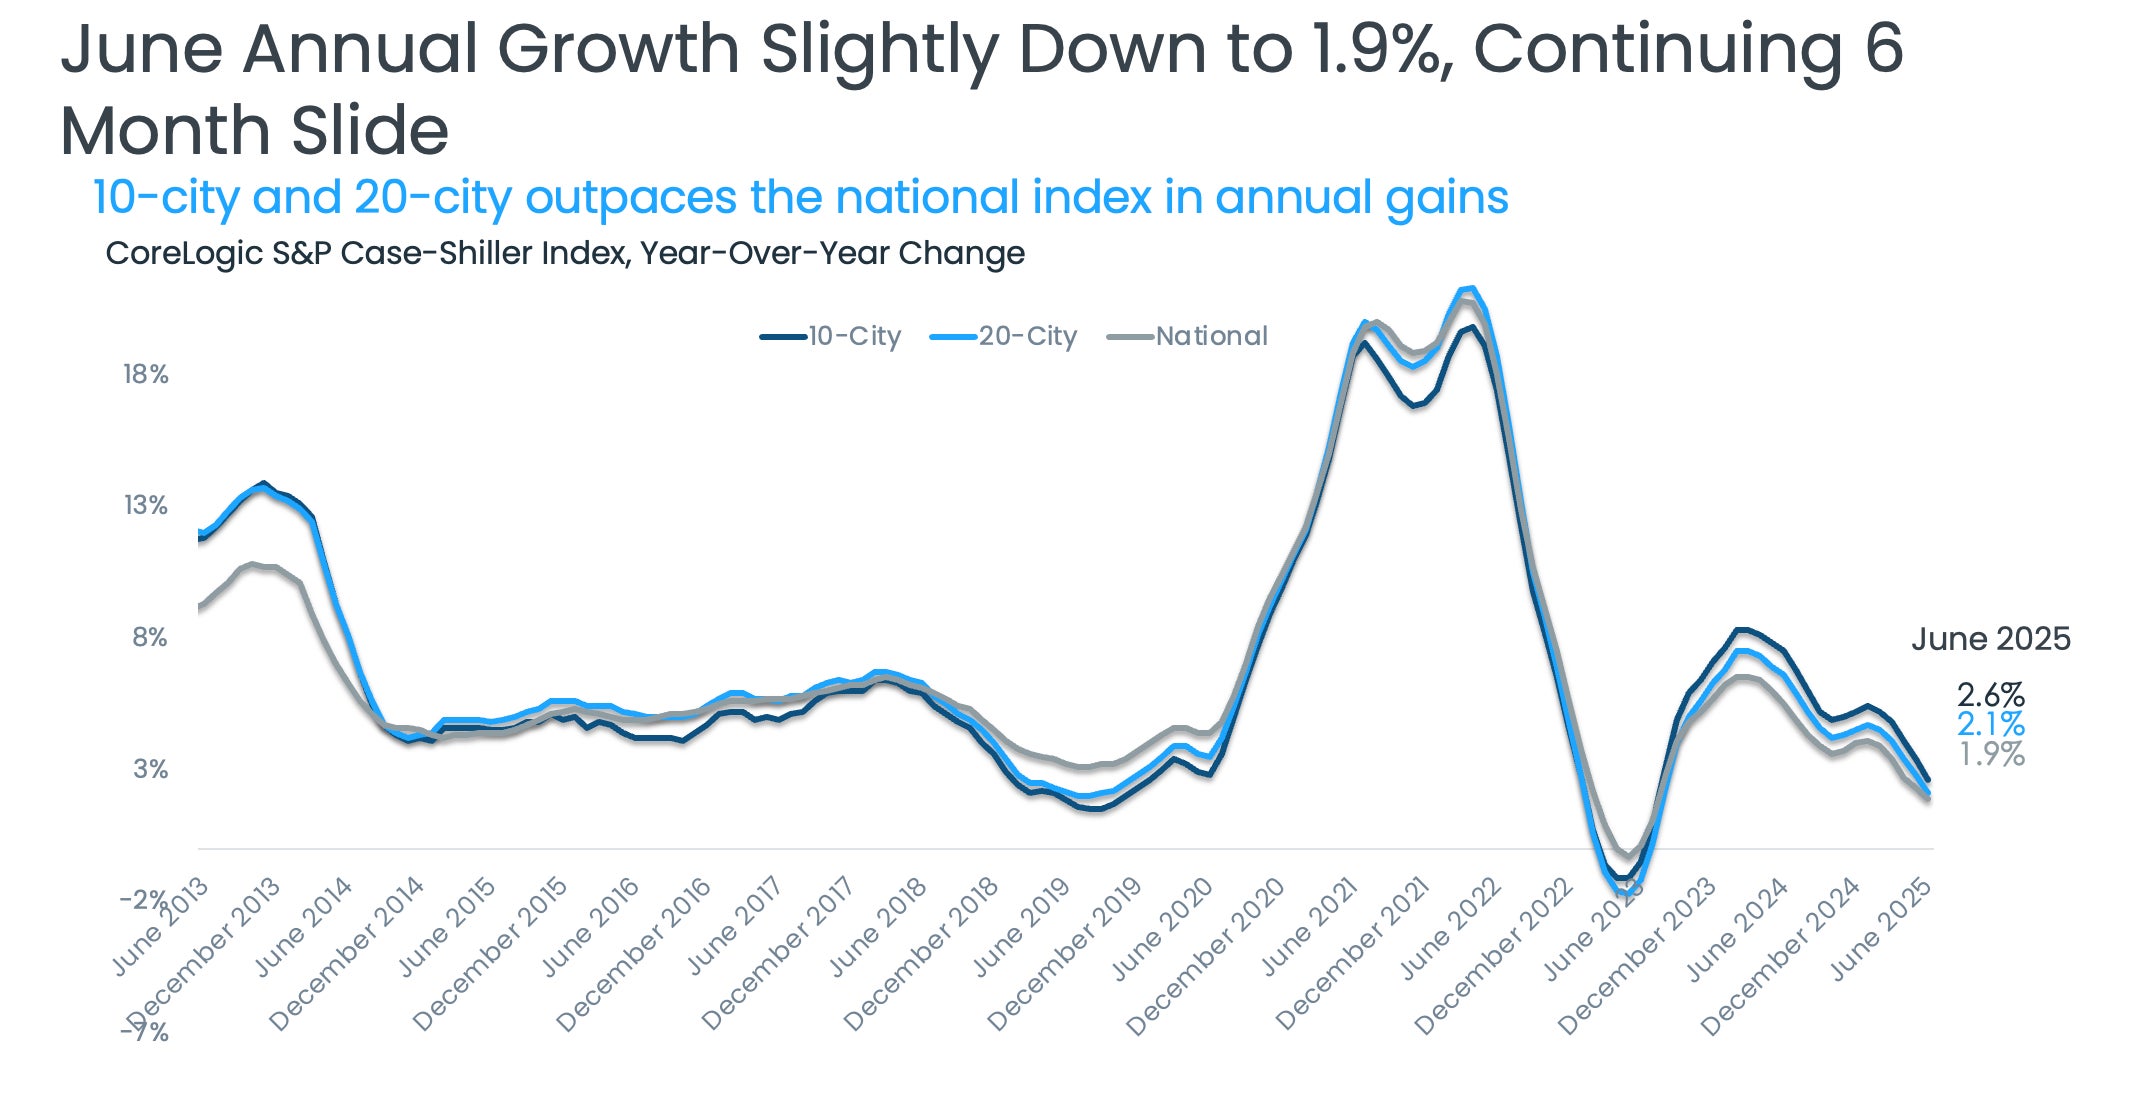
The S&P Cotality Case-Shiller Index rose 1.9% year over year in June, continuing its deceleration from 6.5% at the start of 2024 (Figure 1). This slowdown is expected to persist, and nationwide price declines are increasingly likely. Already, when accounting for inflation, prices fell. The index appreciated less than the overall U.S. inflation rate of 2.7%.
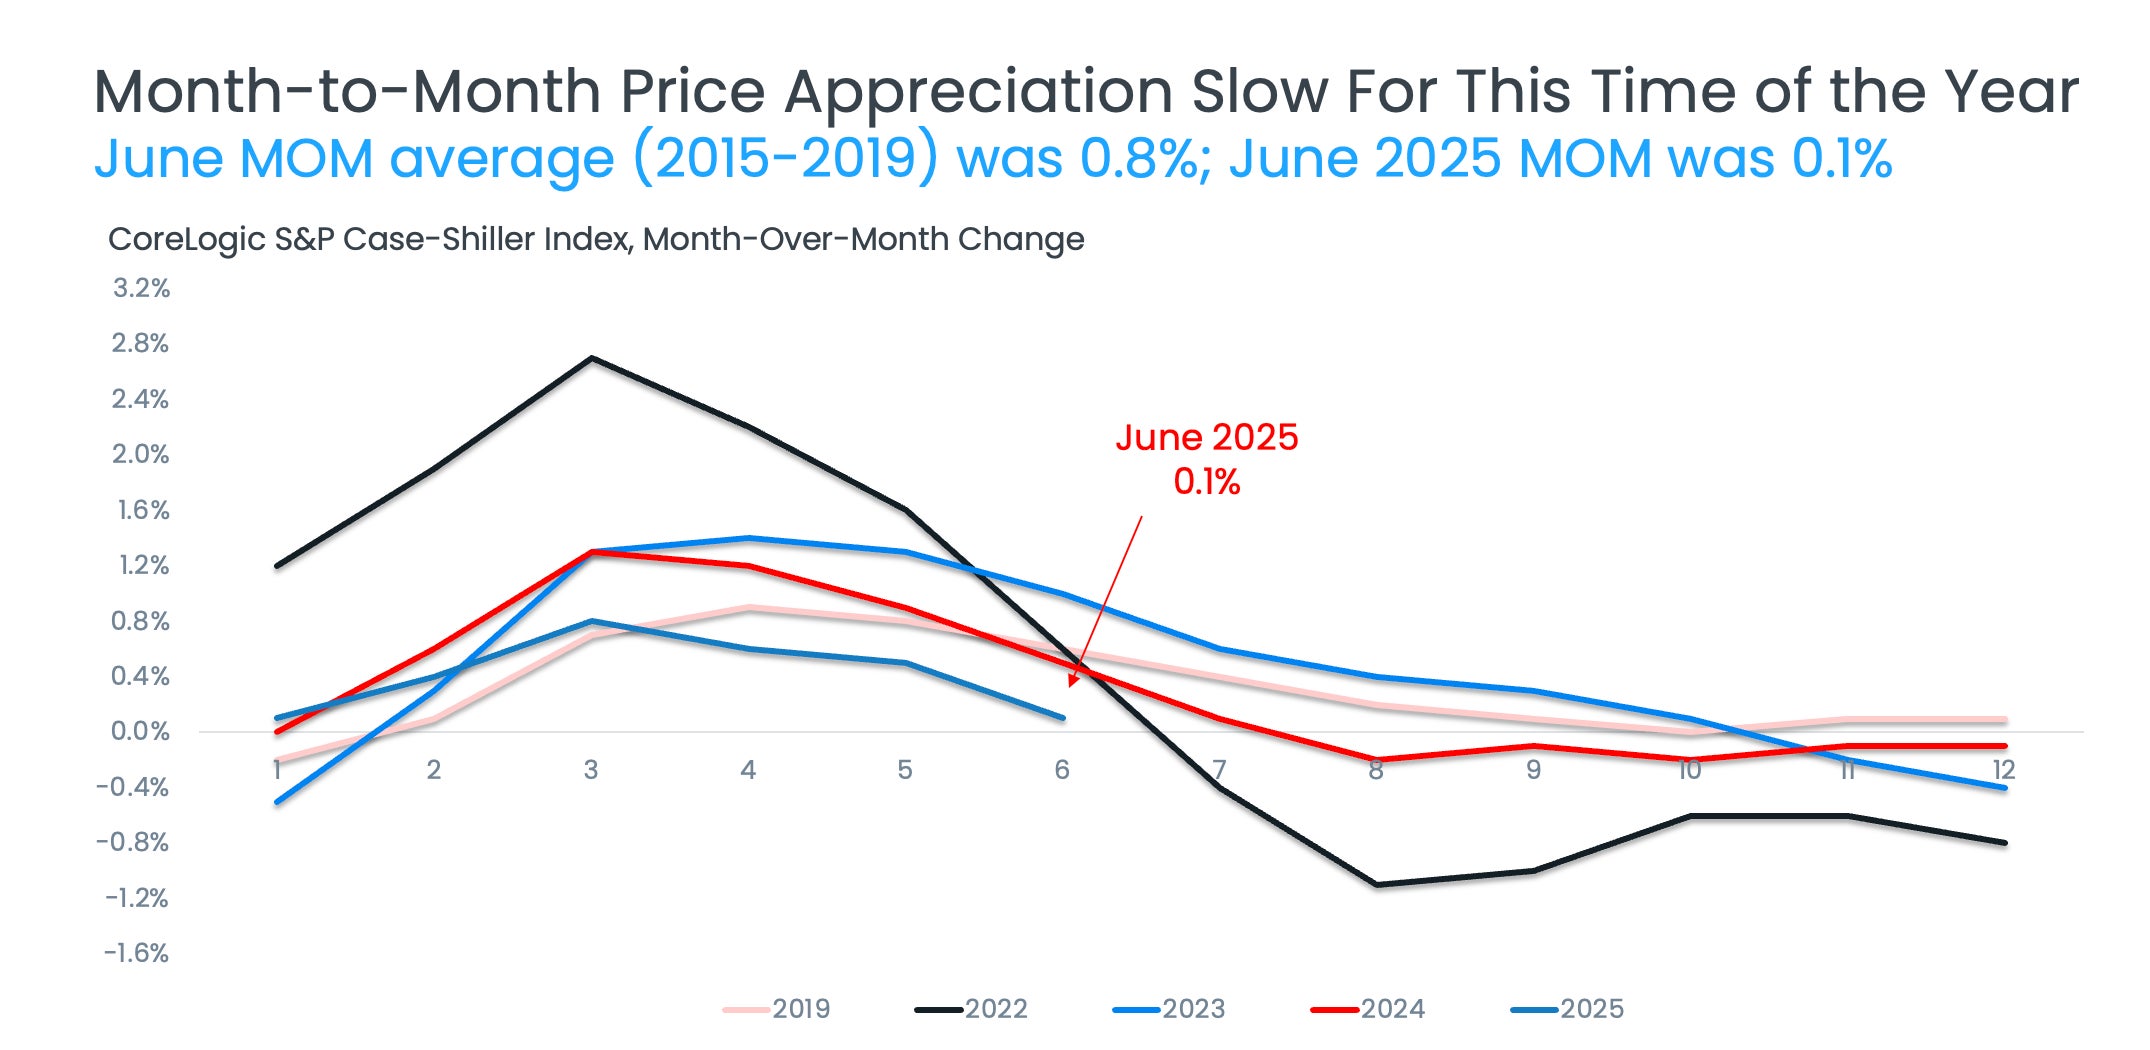
On a non-seasonally adjusted basis, the index rose just 0.1% month over month in June. A monthly increase above 1% hasn’t occurred since April 2024, and June’s increase is well below the average 0.8% June increase recorded between 2015 and 2019 (Figure 2).
The 10-city and 20-city composite indexes posted monthly declines for the first time in 2025 although annual growth remained positive at 2.6% and 2.1%, respectively. These figures are less than one-third of their early 2024 peaks — 8.3% for the 10-city composite index and 7.5% for the 20-city composite index — and are far below the 15–20% growth rates seen in 2021 and early 2022.
Since 2005, the national index has risen 93%, the 10-city composite is up 74%, and the 20-city composite has grown 80%. Most of this growth occurred in the past five years when the three indexes increased more than 50%. However, strong inflation, which jumped up 24% over the past five years and 66% over the past 20 years, has tempered these gains.
"Home price growth slowed down in June to 1.9% annually, but the market is sharply bifurcated by geography," said Cotality Principal Economist Thom Malone. "The Northeast and Midwest are posting robust annual price gains like 7% in New York City and 6.1% in Chicago. Meanwhile, Sun Belt and Western metros, including Tampa, Dallas, San Francisco, and Denver, are seeing price declines. Affordability remains strongest in the Midwest, where lower prices offer buyers a foothold. In the South and the West, a hangover from pandemic-era appreciation remains, and rising insurance premiums are contributing to price declines in those regions."
Data source: S&P Cotality Case-Shiller Indices, not seasonally adjusted (August 2025 release)
Data source: S&P Cotality Case-Shiller Indices, not seasonally adjusted (August 2025 release)
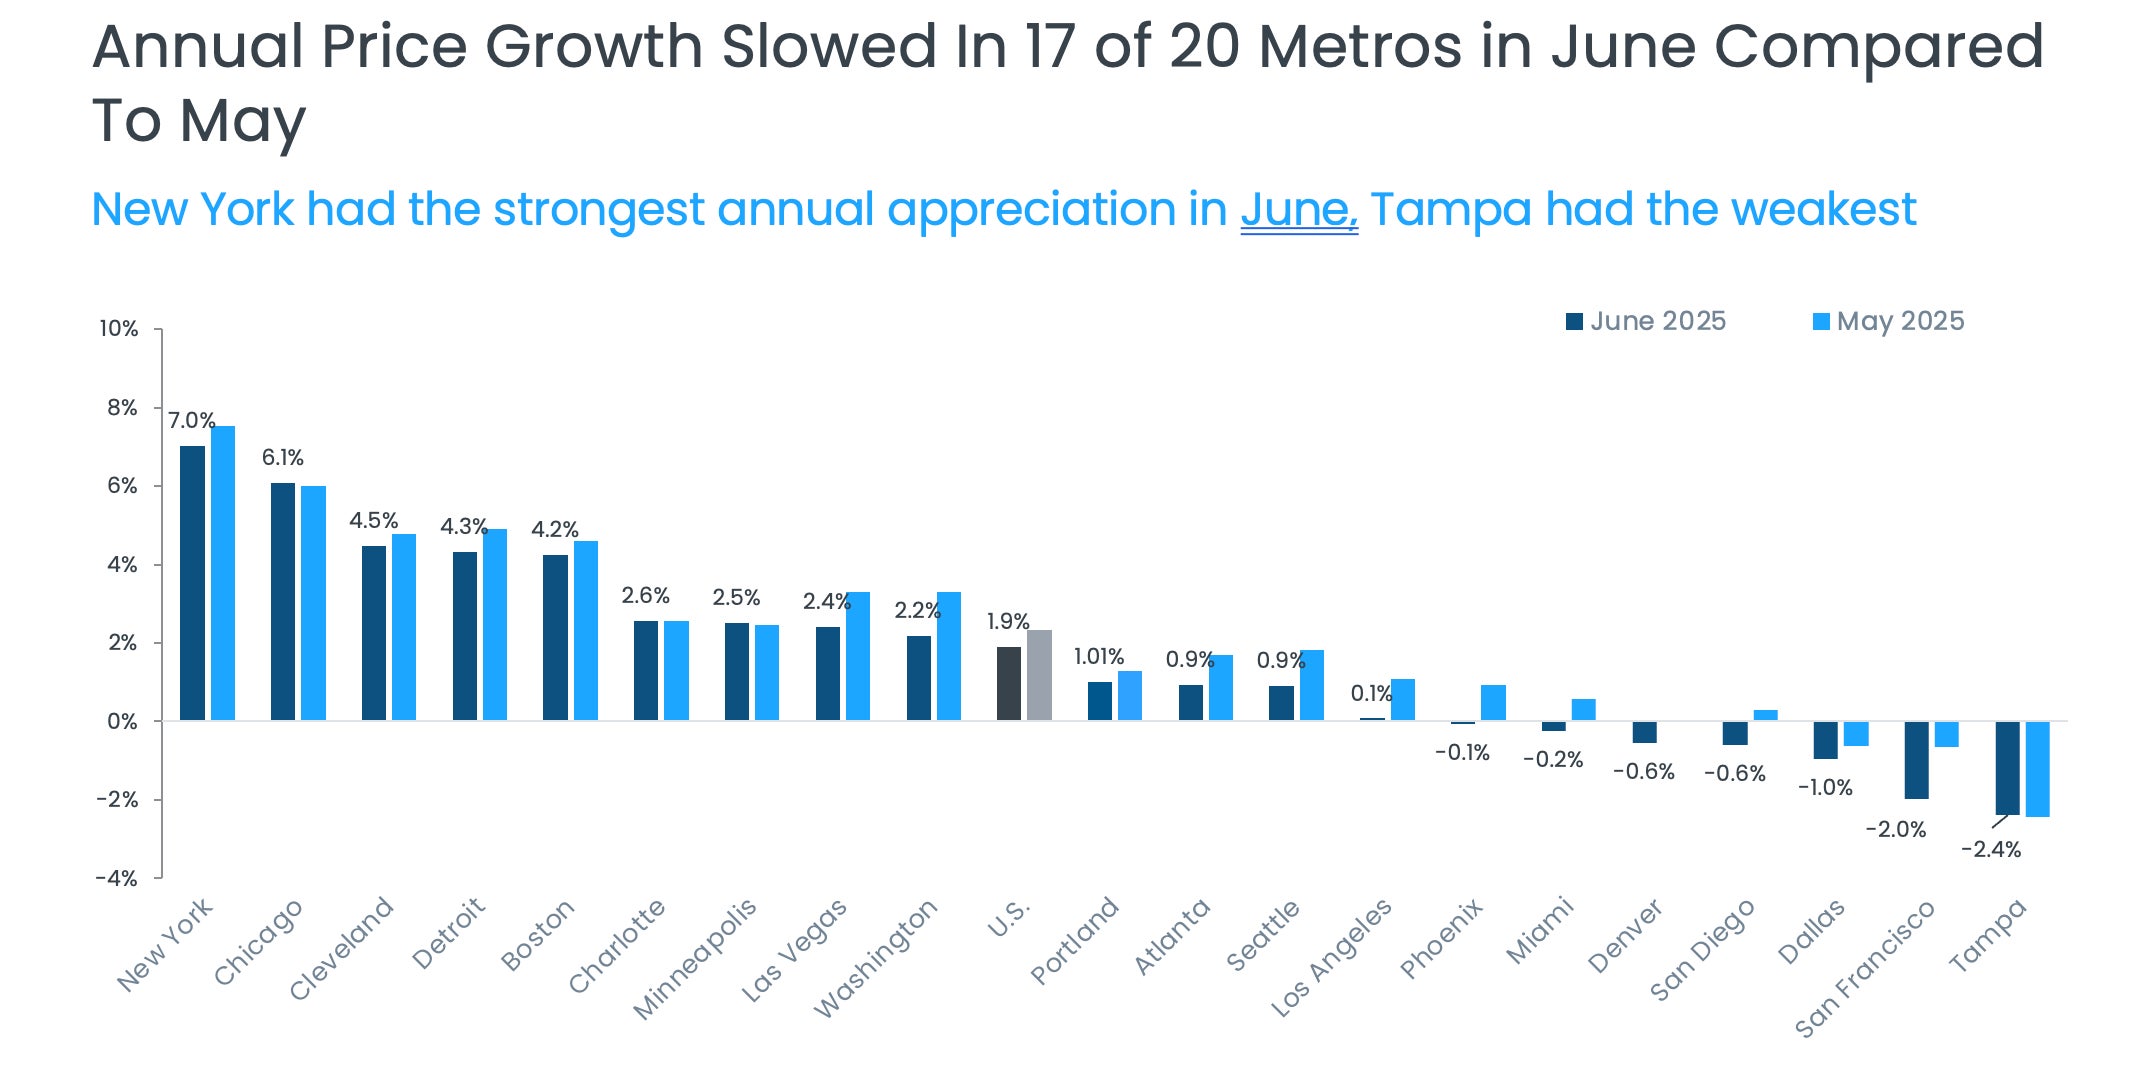
In June, nearly all metros in the 20-City Index saw slower year-over-year price growth compared to May (Figure 3). San Francisco posted the largest cooldown, slipping from a -0.6% decline in May to a -2.0% annual decline in June. Washington, D.C.; Los Angeles; and Phoenix also saw growth rates drop by more than 1 percentage point. Only three metros avoided slowdowns and saw slight increases in growth rates: Chicago, Minneapolis, and Tampa.
New York, Chicago, and Cleveland recorded the fastest appreciation among the 20-city metros, with annual increases of 7%, 6.1%, and 4.5%, respectively. Nine metros posted annual price gains above the national 1.9% increase. Losses were seen in seven metros, with Tampa experiencing the steepest decline at -2.4%.
Data source: S&P Cotality Case-Shiller Indices, not seasonally adjusted (August 2025 release)
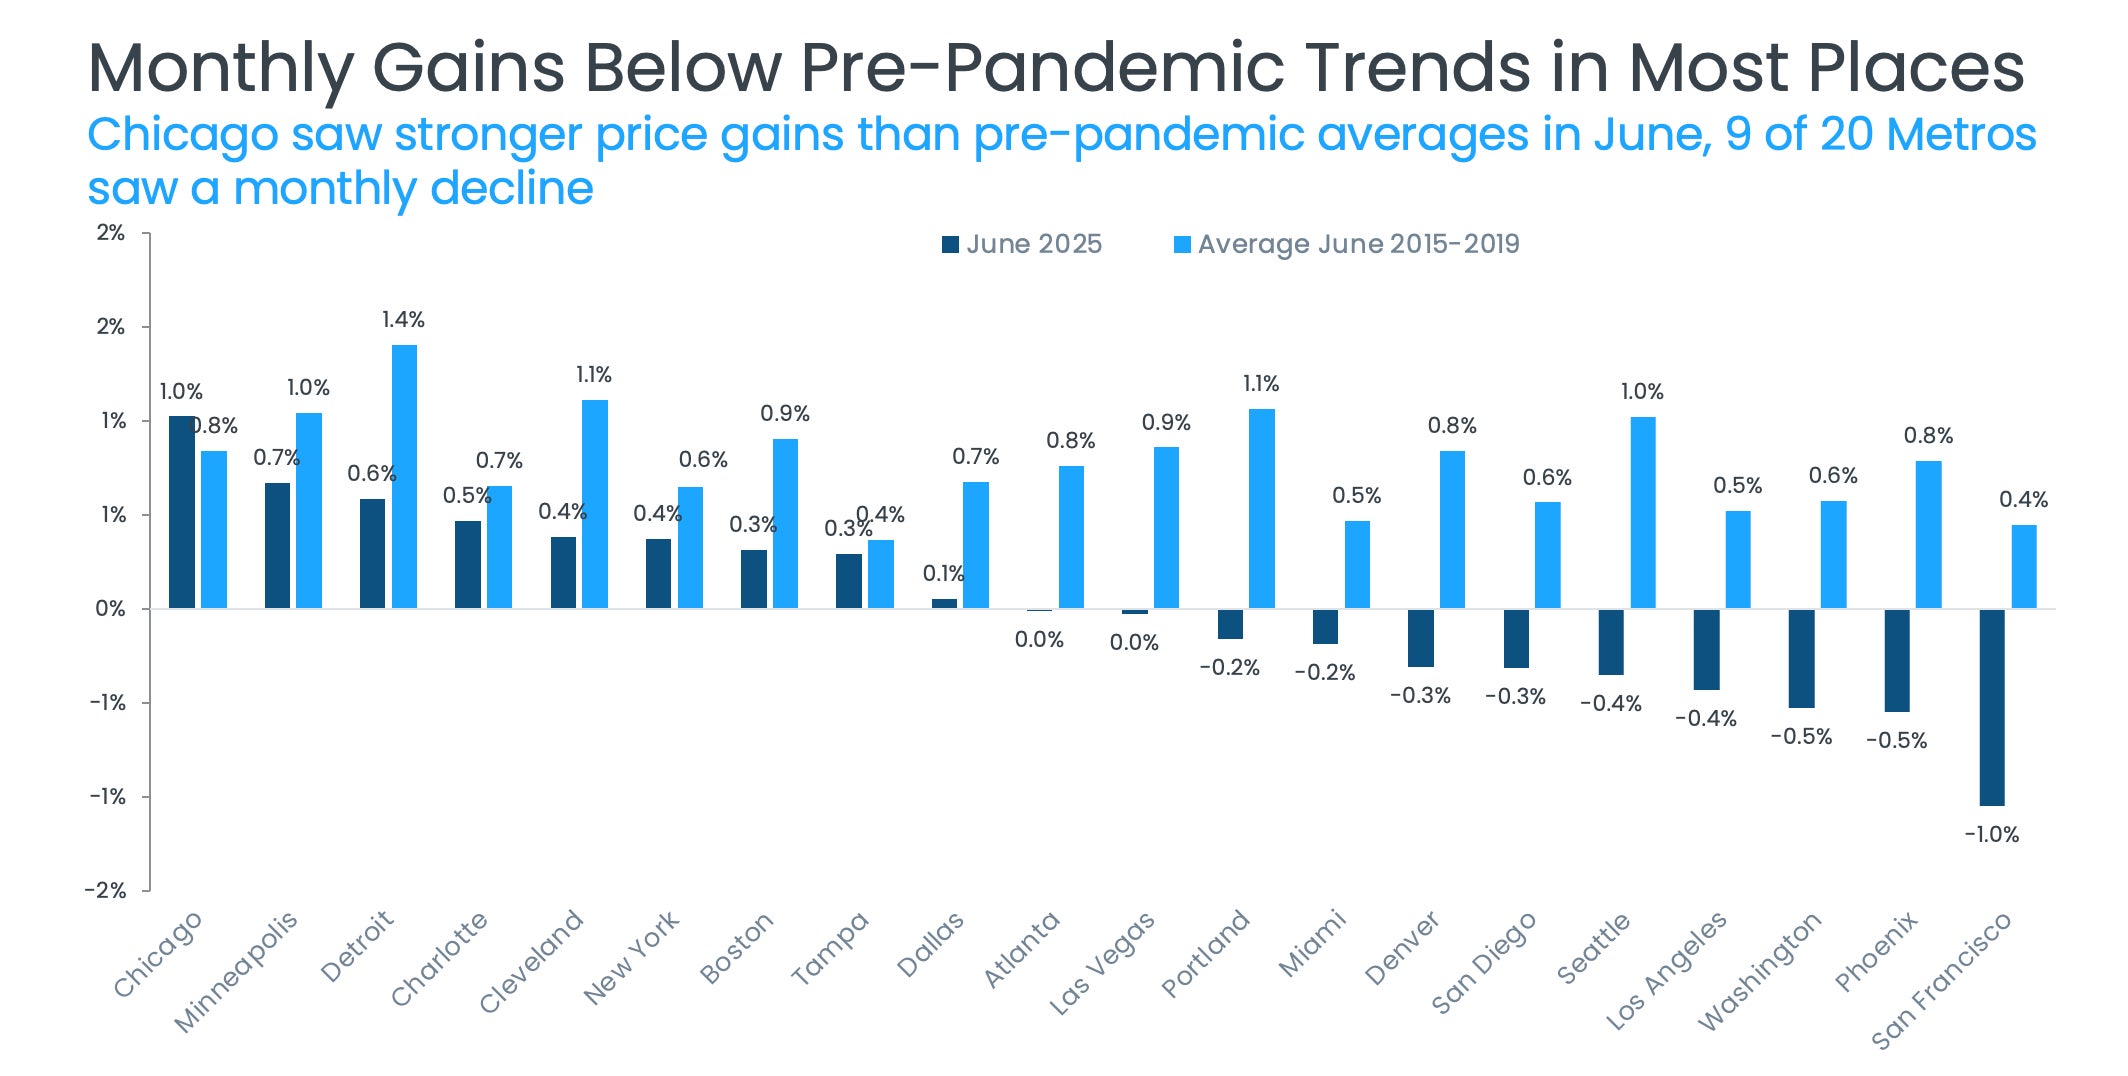
National home prices rose by just 0.1% from May to June, which is well below the pre-pandemic June average of 0.8% (Figure 4). There is also a clear geographic divide: Western metros such as San Francisco, Los Angeles, and Phoenix dragged the national average down while Midwestern metros including Chicago, Minneapolis, and Cleveland provided a counterbalance with their growth.
Data source: S&P Cotality Case-Shiller Indices, not seasonally adjusted (August 2025 release)
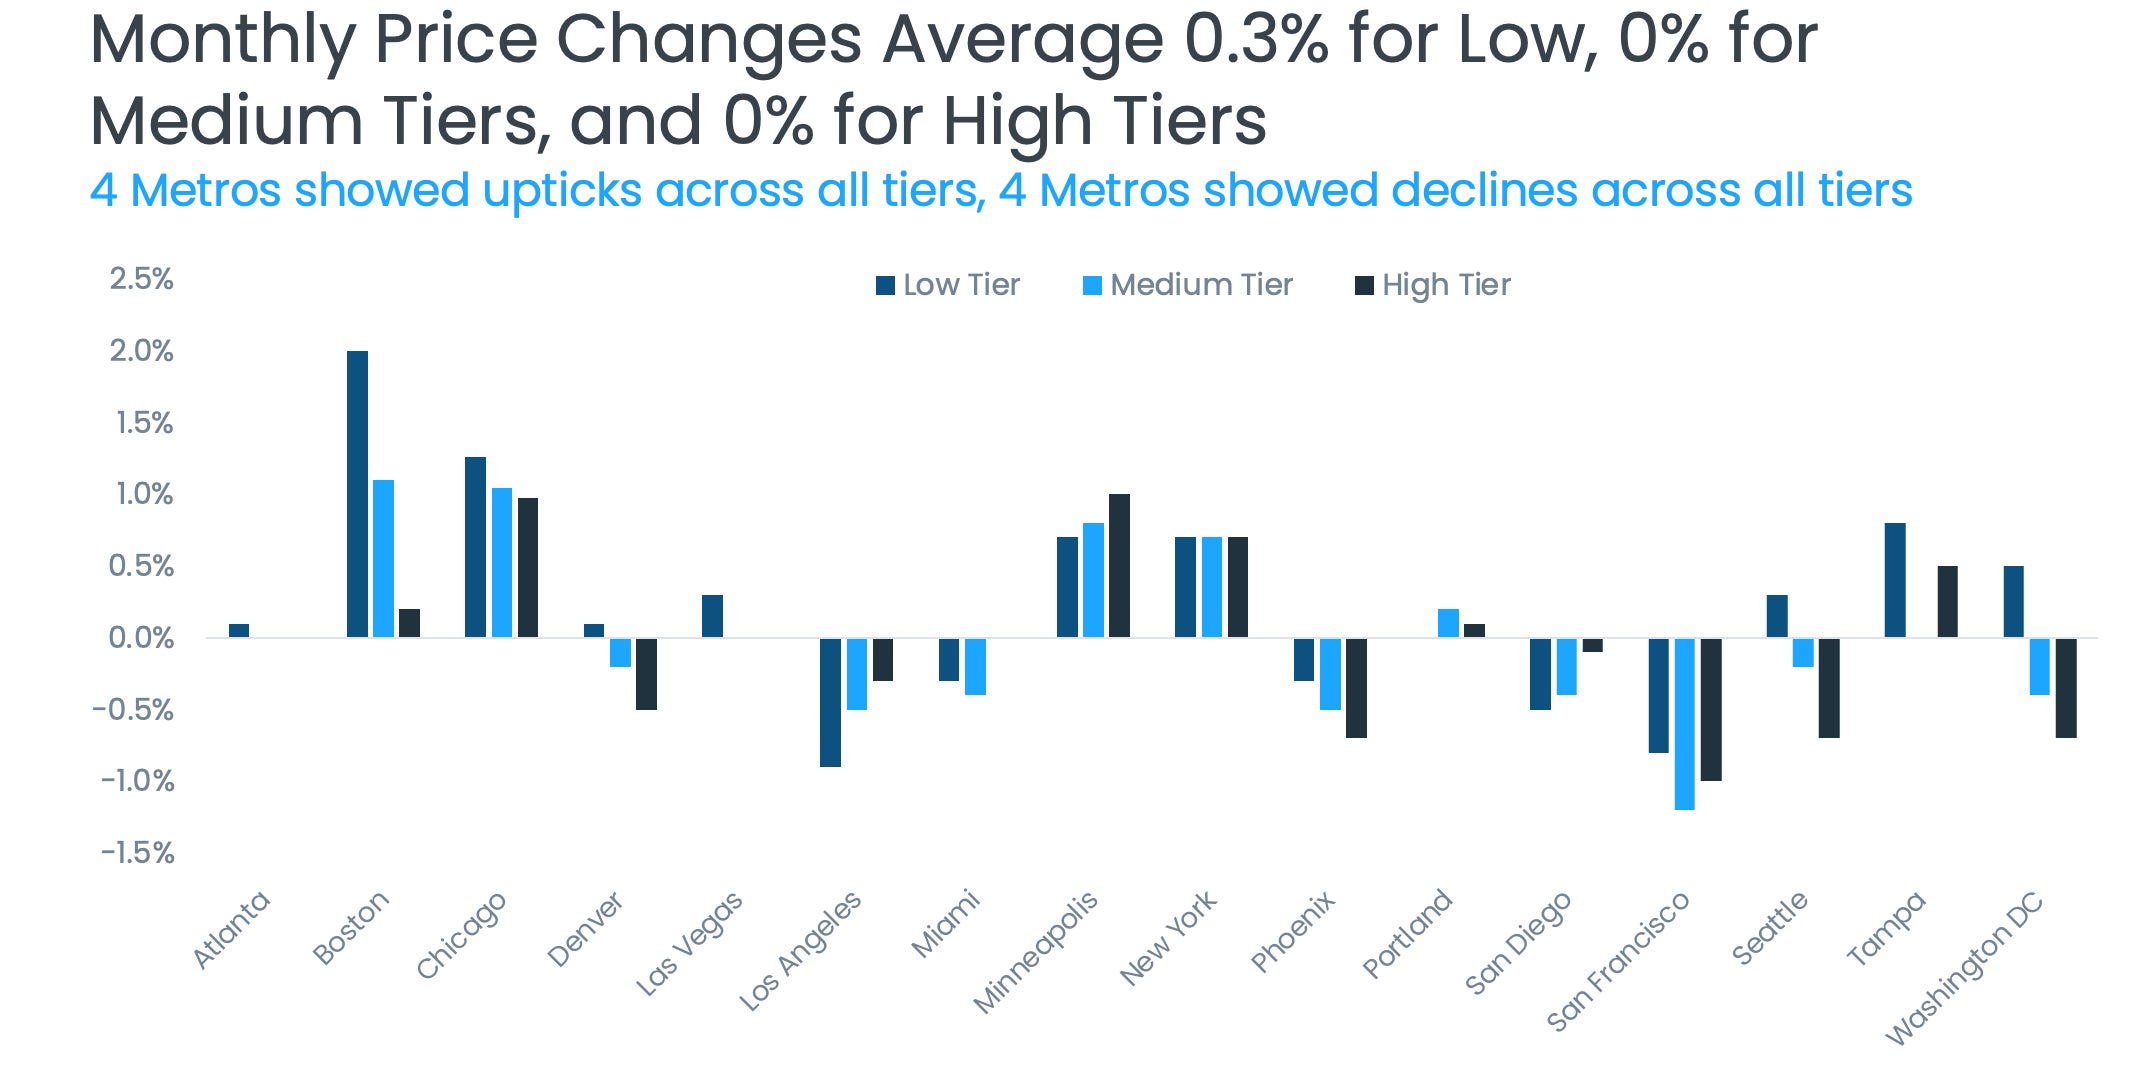
A month-over-month comparison by price tier shows that geography, rather than submarkets within metros, is driving market divergence. In June, prices rose across all three tiers in four metros. Four markets saw declines across all price tiers. In most metros, price changes were modest across all tiers, with Boston’s low-priced tier being a notable exception, posting growth above 2% (Figure 5).
Across the 20 metros, high- and middle-priced tiers remained flat on average month over month while low-priced tiers saw a modest increase of 0.3%. The consistency across price tiers underscores that the housing market story is increasingly one of regional divergence (Figure 5).
Data source: S&P Cotality Case-Shiller Indices, not seasonally adjusted (August 2025 release)
For-sale inventory ticked up this spring, but most buyers remained on the sidelines despite initial signs of interest. Elevated housing costs and mortgage rates — not inventory levels — are now the primary constraint on home sales. While increased inventory is helping balance conditions between buyers and sellers, it has yet to translate into stronger buyer activity.
As economic conditions and policy uncertainties become clearer, buyer participation may improve. This summer, the housing market is showing signs of change, offering potential opportunities for buyers. With more homes available, competition may ease, giving buyers more negotiating power and time to make informed decisions. However, whether this leads to a meaningful shift remains uncertain.
About Cotality
Cotality accelerates data, insights, and workflows across the property ecosystem to enable industry professionals to surpass their ambitions and impact society. With billions of real-time data signals across the life cycle of a property, we unearth hidden risks and transformative opportunities for agents, lenders, carriers, and innovators. Get to know us at www.cotality.com.
Media Contact
Charity Head
Cotality


