


Press Release
August marks seven months of slipping home prices


The S&P Cotality Case-Shiller Home Price Index, formerly known as the S&P CoreLogic Case-Shiller Home Price Index, is a leading measure of U.S. residential real estate prices.
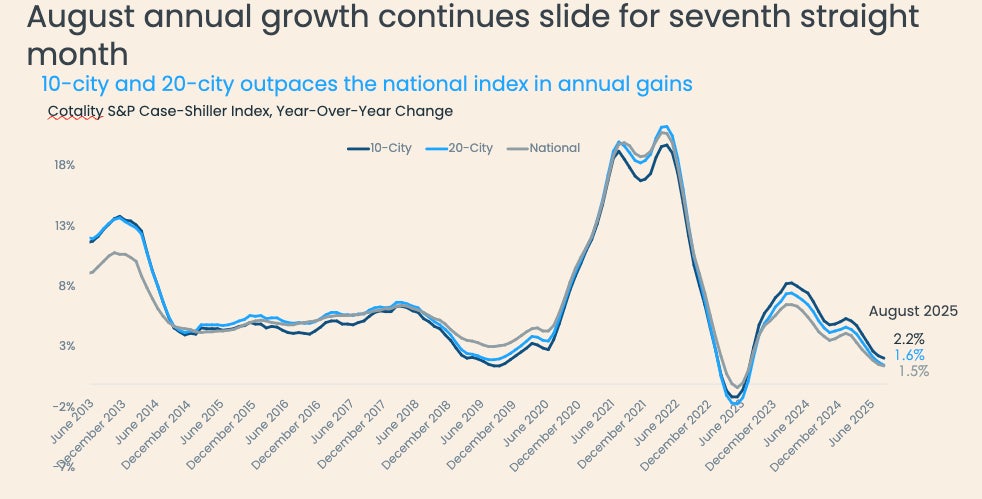
IRVINE, Calif., October 28, 2025 — August marks the changing of the seasons, and as summer began to fade into fall, home price growth continued to cool. The S&P Cotality Case-Shiller Index continued its gradual decline in annual gains, falling to 1.5% in August (Figure 1). The 10-city and 20-city composite indexes showed slightly more resilience but they also declined, dropping 1.6% and 2.2%, respectively.
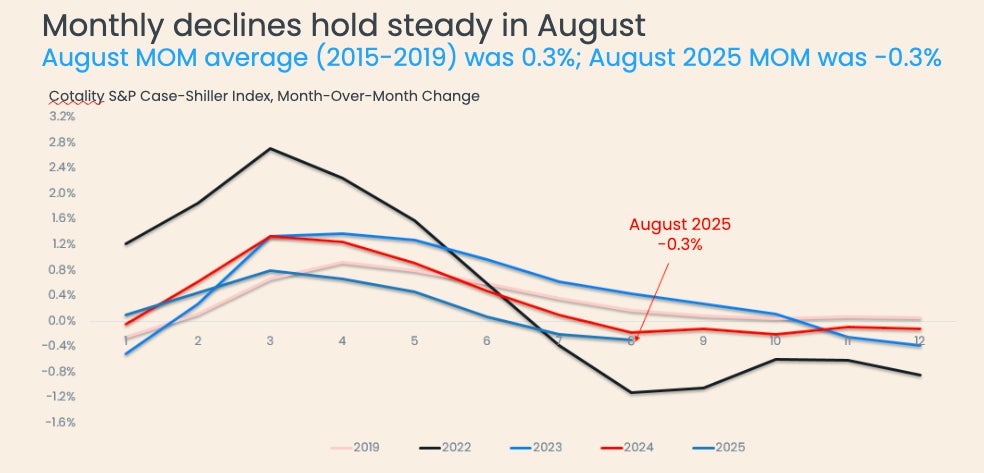
Month over month, the non-seasonally adjusted index fell by -0.3% (Figure 2), a slightly larger drop than July’s -0.2%. This decline is well below the typical 0.3% August gain. The fall season is shaping up to exhibit similar trends, and Cotality data shows that these declines may continue into September and October.
“Home price growth slowed in August to 1.5% annually and -0.3% monthly. Chicago was the only metro to post a monthly gain. However, other Midwestern cities like Cleveland and Detroit are shifting from rising to falling prices, so it’s likely that Chicago will soon follow suit,” said Cotality Principal Economist Thom Malone. “Western metros are driving price declines, with Portland and Los Angeles both seeing monthly drops of -1.0%. The widespread weakness reflects a standoff between buyers and sellers leading to rising inventory and longer days on market as sellers hold out for the best possible offer.”
Data source: S&P Cotality Case-Shiller Indices, not seasonally adjusted (October 28, 2025)
Data source: S&P Cotality Case-Shiller Indices, not seasonally adjusted (October 28, 2025)
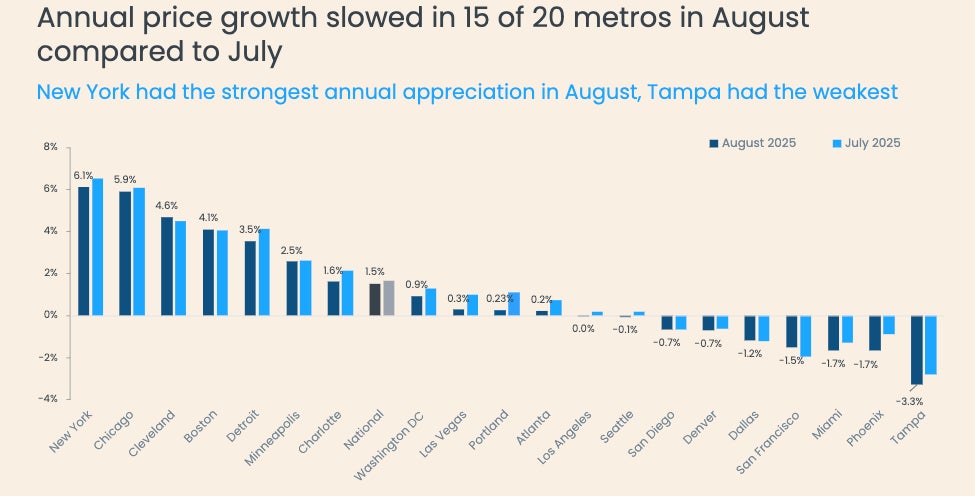
In July, 15 of the 20 metros in the 20-City Index saw year-over-year price growth slow compared to the previous month (Figure 3). Portland saw the sharpest reversal, falling from 1.1% to 0.2%. But some metros did log price growth. New York, Chicago, and Cleveland led with annual increases of 6.1%, 5.9%, and 4.6%, respectively. Midwestern cities, supported by their relative affordability, are the most likely to end 2025 with positive annual price growth. Meanwhile, eight metros posted annual declines, with Tampa experiencing the steepest drop at -3.3%. Los Angeles, Atlanta, and Portland are poised to transition into annual declines, each recording 0.2% appreciation or less in August. This trend suggests that price declines will continue to spread nationwide in the coming months.
Data source: S&P Cotality Case-Shiller Indices, not seasonally adjusted (October 28, 2025)
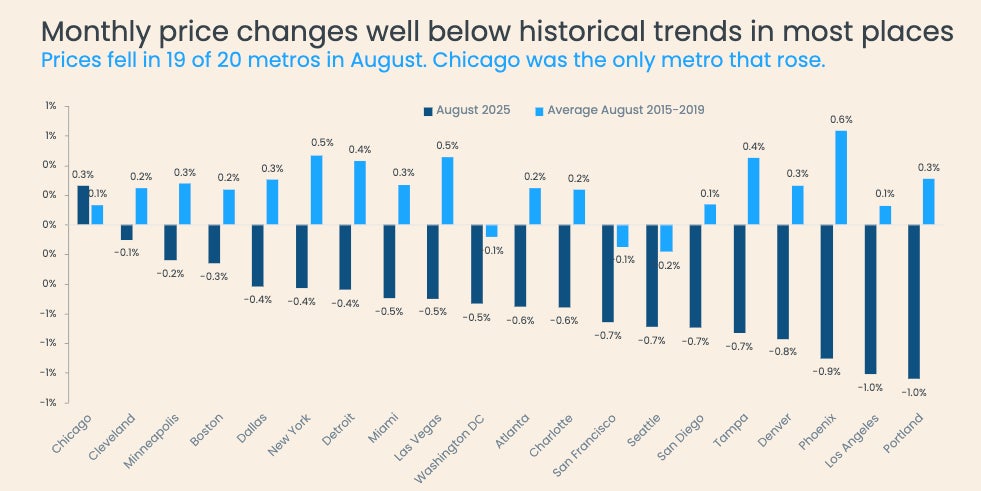
On a monthly basis, Portland experienced the largest overall price decline of -1.0% (Figure 4), followed by Los Angeles, Phoenix, Denver, and Tampa. Chicago was the only metro to post a monthly increase, rising 0.3% to exceed its pre-pandemic average. Month over month, prices fell in 19 of the 20 metros — up from 15 in July. With Minneapolis, Detroit, and Cleveland all shifting from monthly gains to losses, Chicago may soon follow.
Data source: S&P Cotality Case-Shiller Indices, not seasonally adjusted (October 28, 2025)
Price declines were consistent across market segments, with average monthly drops of -0.5% for low-priced homes, -0.5% for mid-priced homes, and -0.7% for high-priced homes (Figure 5). These declines appear to be regional, and only Chicago and New York escaped these monthly declines.
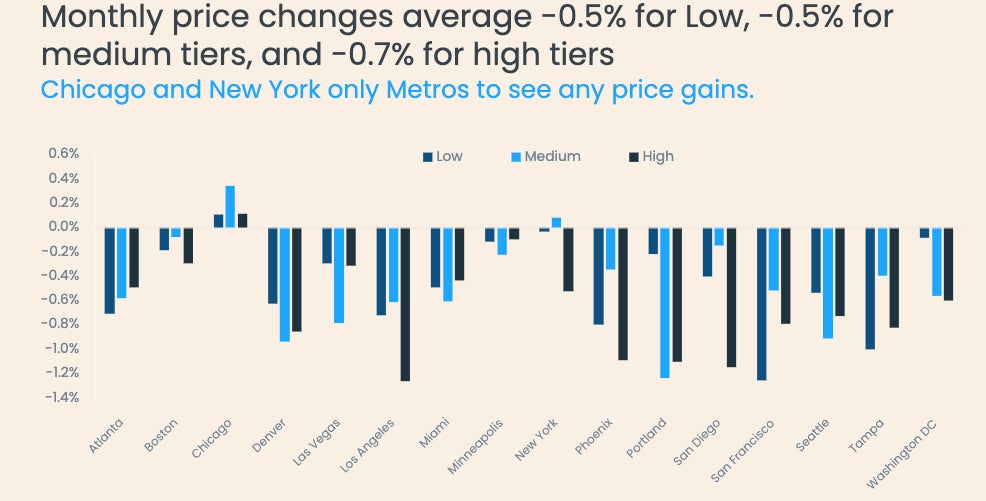
Data source: S&P Cotality Case-Shiller Indices, not seasonally adjusted (October 28, 2025)
August’s monthly decline suggests that sellers may be reaching their limit and are beginning to accept lower prices. However, with substantial equity and low monthly payments, significant price drops are unlikely for the remainder of 2025. Prices could fall more sharply if an external shock forces sales, but there are no clear indications pointing to a source for such a shock.