


Press Release
CoreLogic: Borrowers Gained Over $280B in Home Equity in 2024


- The average borrower had $303,000 in home equity at the end of 2024 and gained $4,100 over the year.
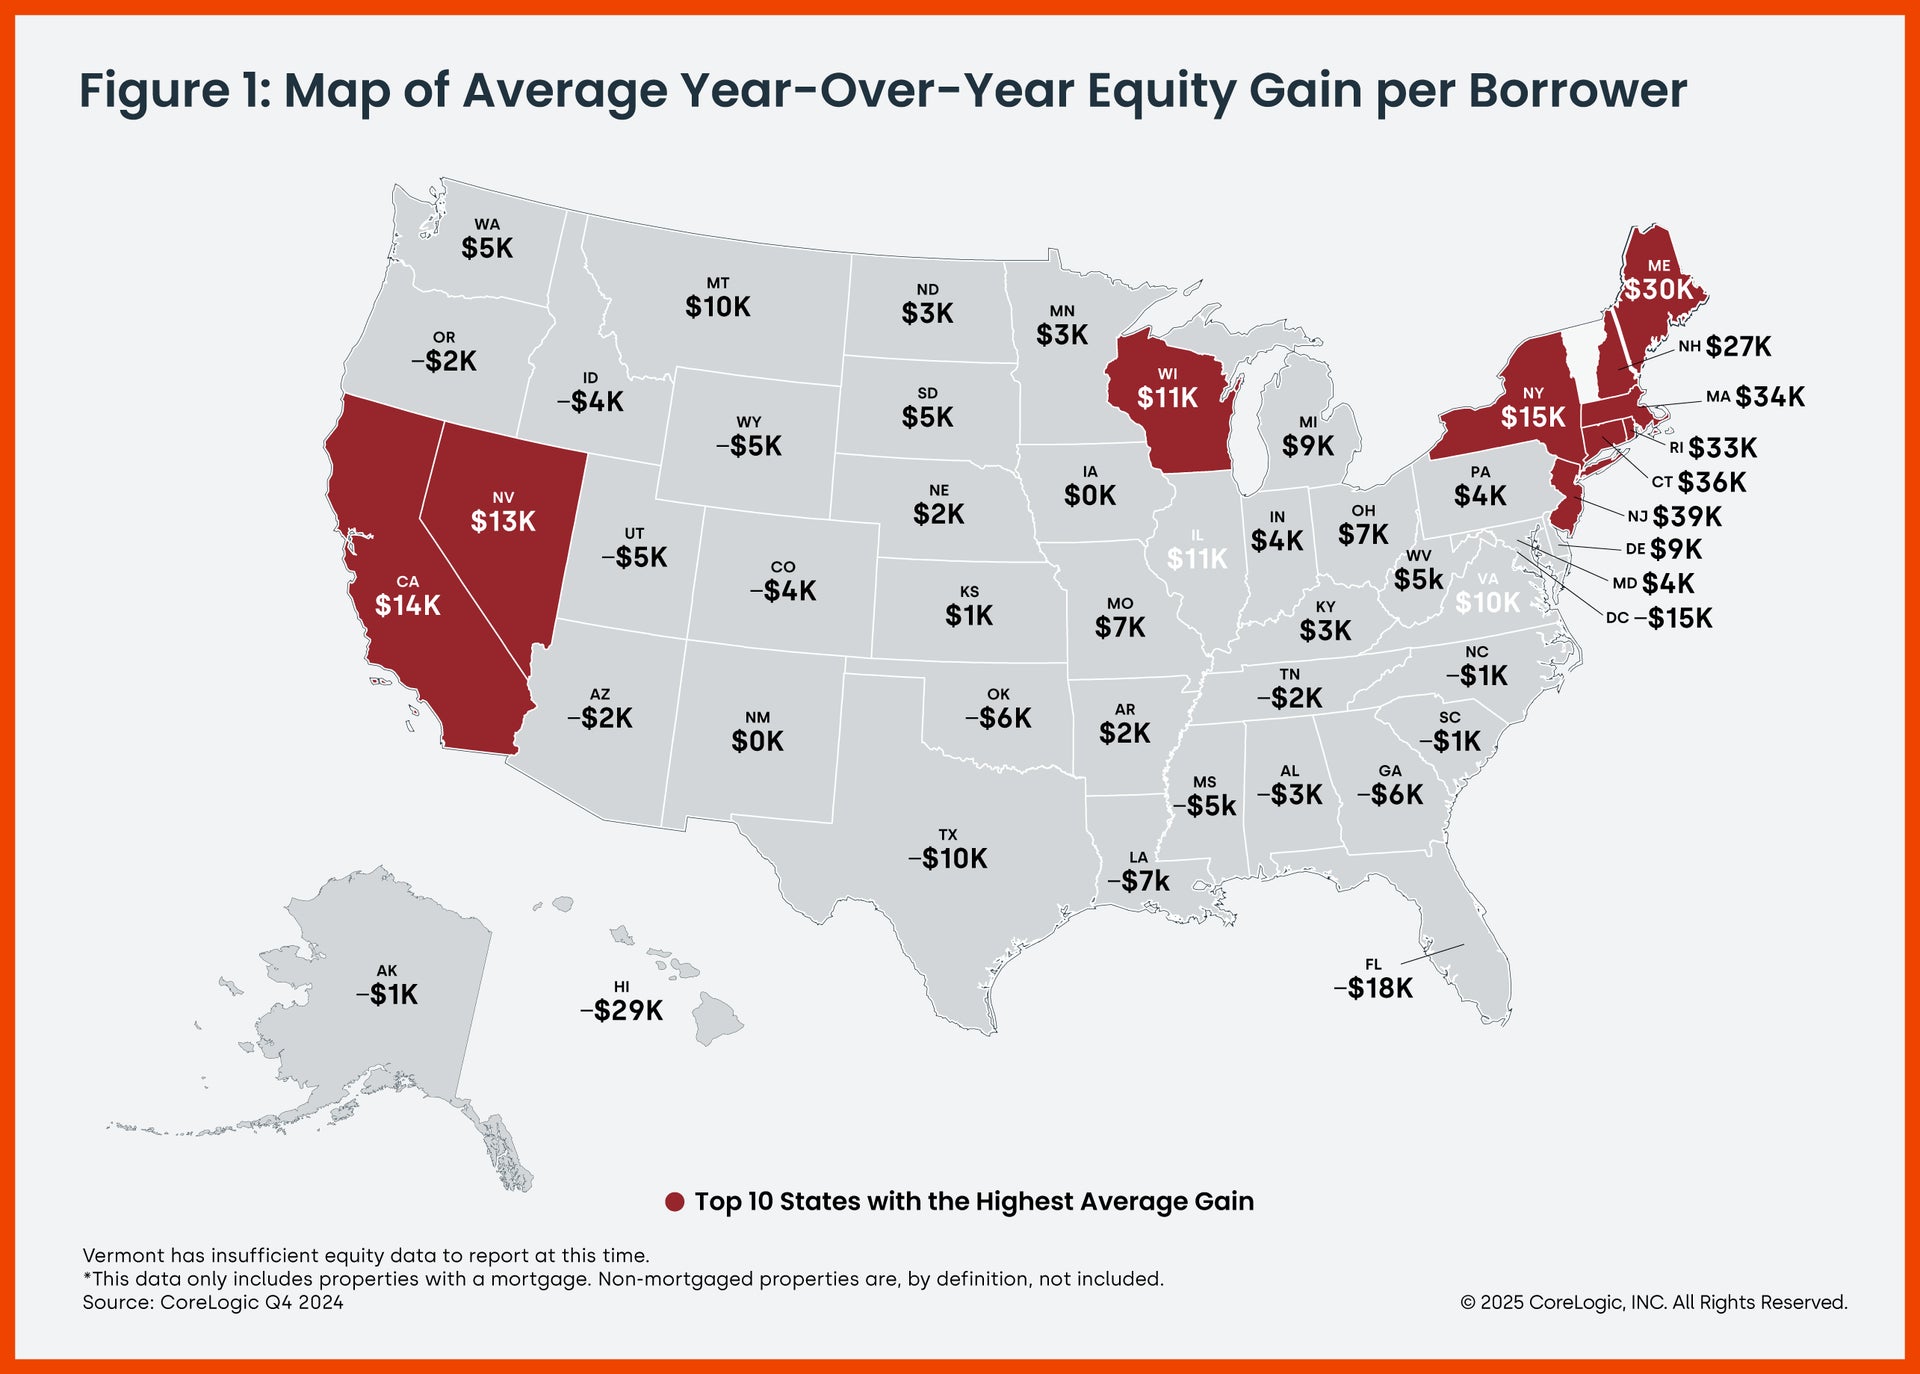
- The largest average gains in home equity were seen in New Jersey ($39K), Connecticut ($36K), and Massachusetts ($34K).
- The negative equity share rose to the highest level since the first half of 2023.
IRVINE, Calif., March 13, 2024 — CoreLogic®, a leading global property information, analytics and data-enabled solutions provider, today released the Homeowner Equity Report (HER) for the fourth quarter of 2024. Nationwide, borrower equity increased by $281.9 billion, or 1.7% year-over-year. The report shows that U.S. homeowners with mortgages (which account for roughly 61% of all properties) saw home equity increase by about $4,100 between Q4 2023 and Q4 2024, which is less than the gain of $6,000 in Q3 2023. The states that saw the largest gains were New Jersey ($39,400), Connecticut ($36,300), and Massachusetts ($34,400), while the largest losses were in Hawaii ($-28,700), Florida ($-18,100), and the District of Columbia ($-14,700).
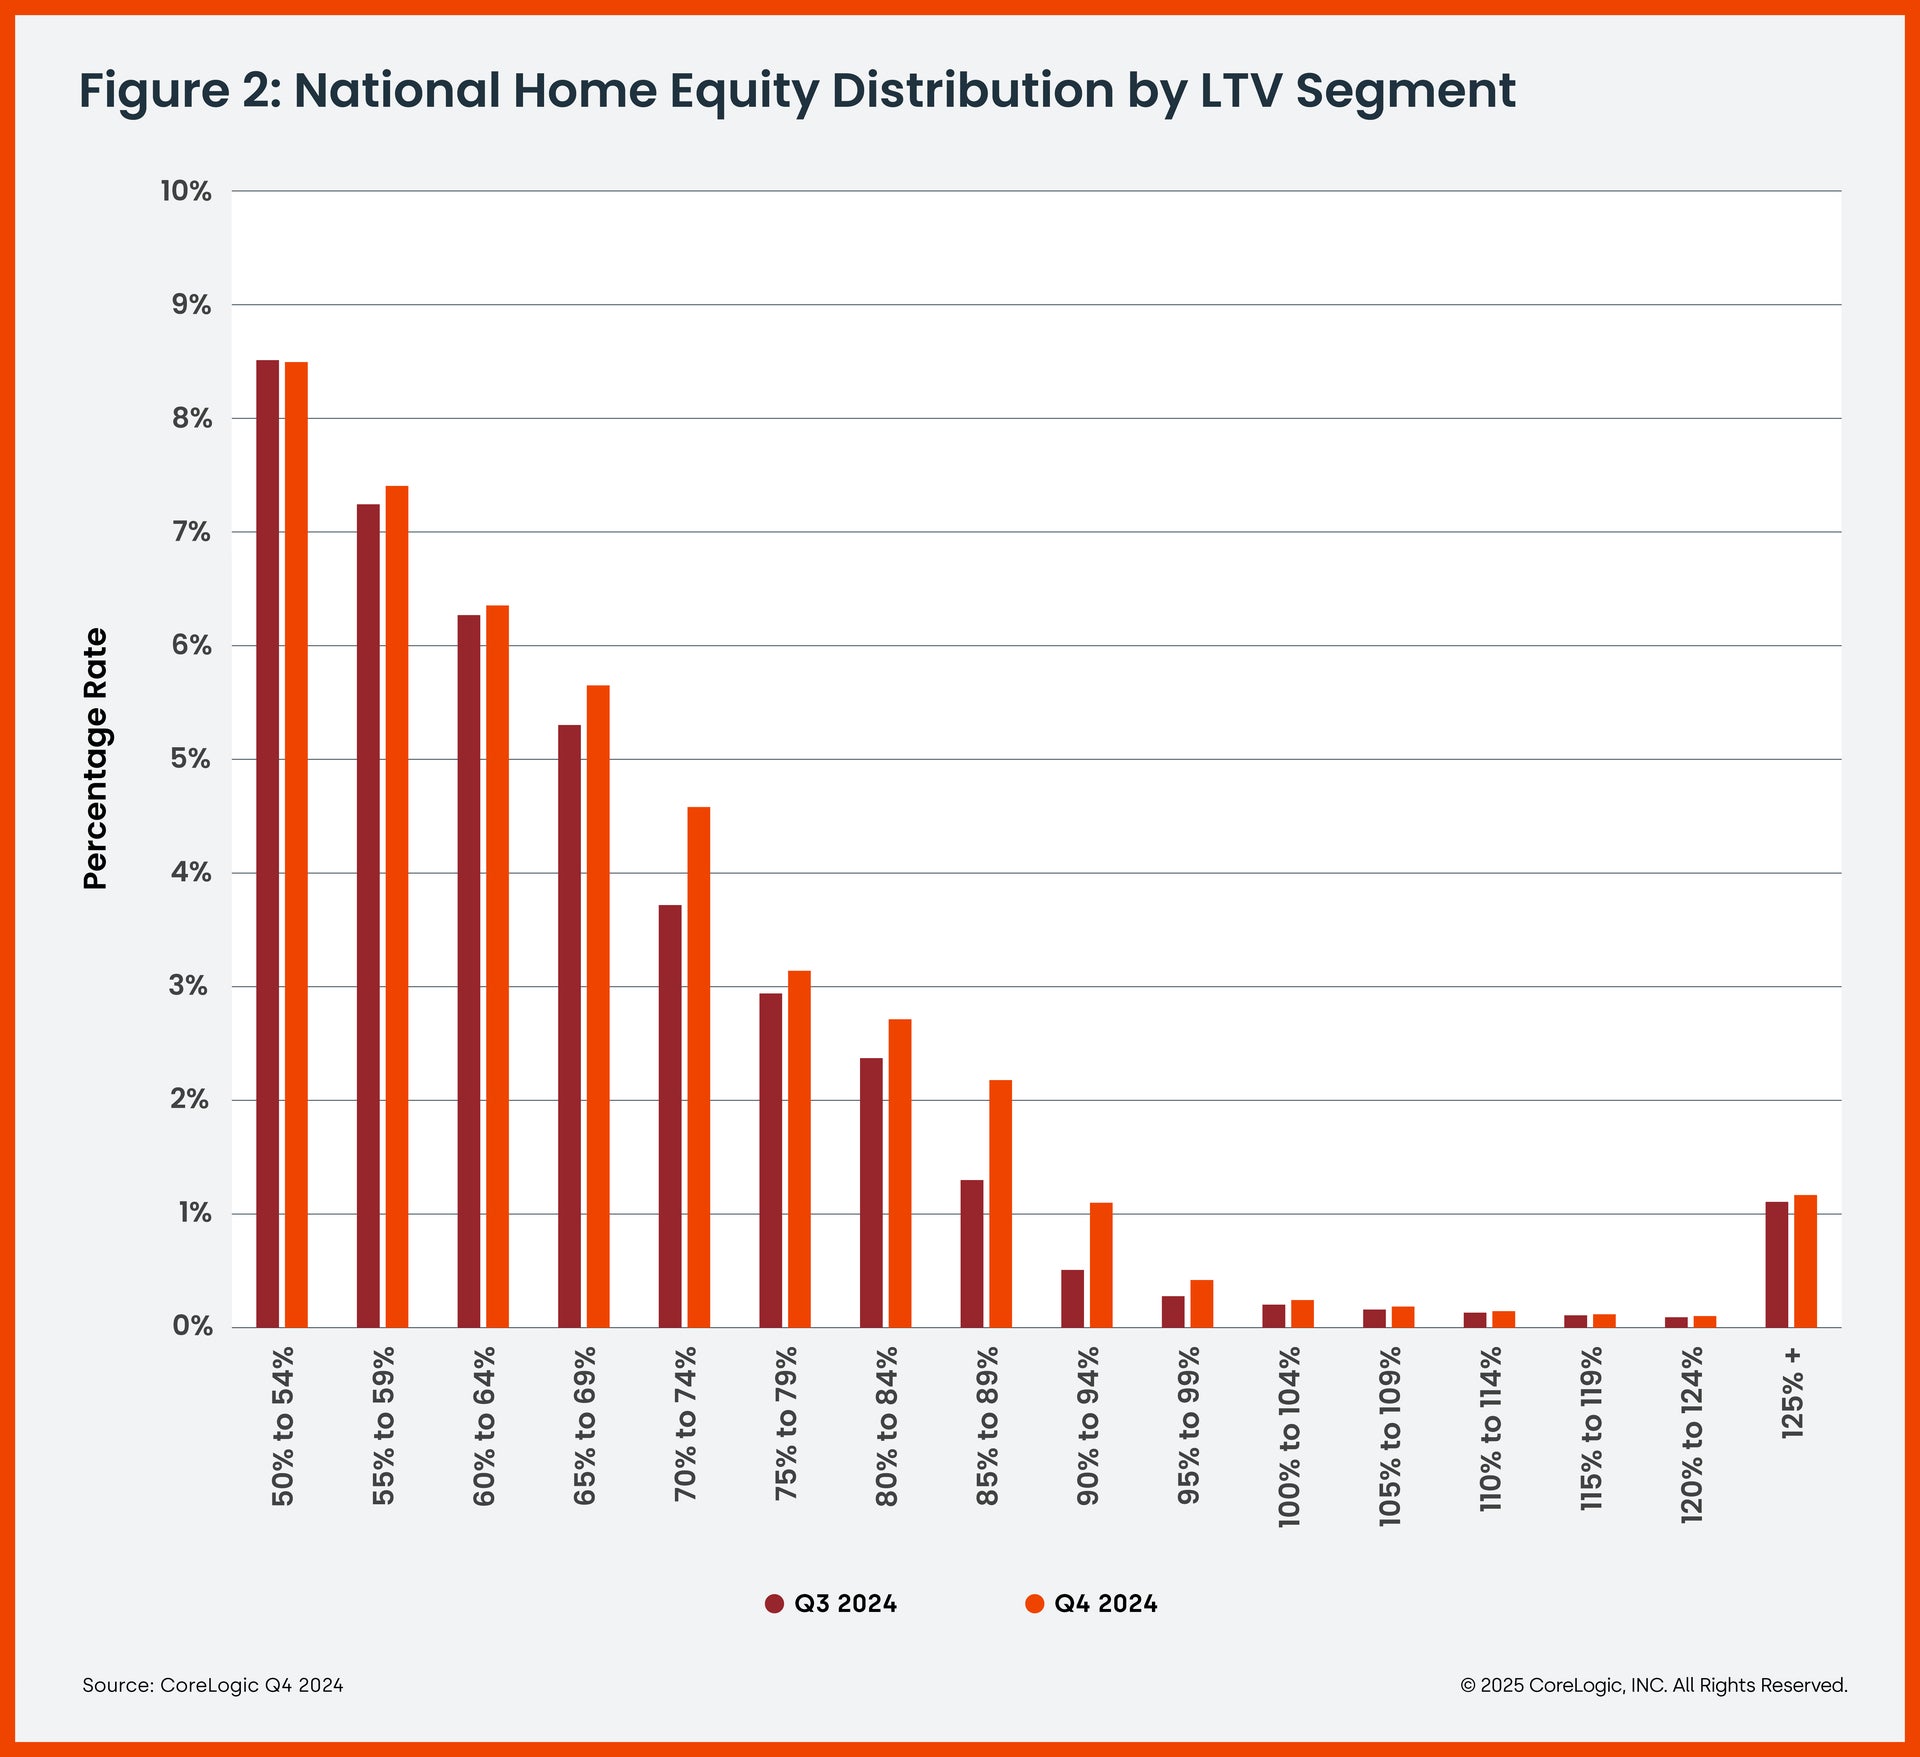
Quarter-over-quarter, the total number of mortgage residential properties with negative equity increased by 9.3% to 1.1 million homes or 2% of all mortgaged properties. While year-over-year, negative equity increased by 7% from 1 million homes, or 1.8% of all mortgage properties.
“Housing equity growth slowed in 2024 versus 2020-2023 due to moderating price appreciation, but homeowners maintain substantial equity gains from prior years, preserving their strong financial position,” said Dr. Selma Hepp, chief economist for CoreLogic.
While home equity is still boosting homeowners’ wealth, home price appreciation is leveling off and tempering equity gains for homeowners across the U.S. In fact, there are clear regional divisions for equity gains. The Northeast continues to lead the way, with other areas of expanding equity encompassing the upper Midwest as well as California and Nevada. Areas with the largest declines dotted the country, but Florida and Washington D.C. were notable areas with decreases.
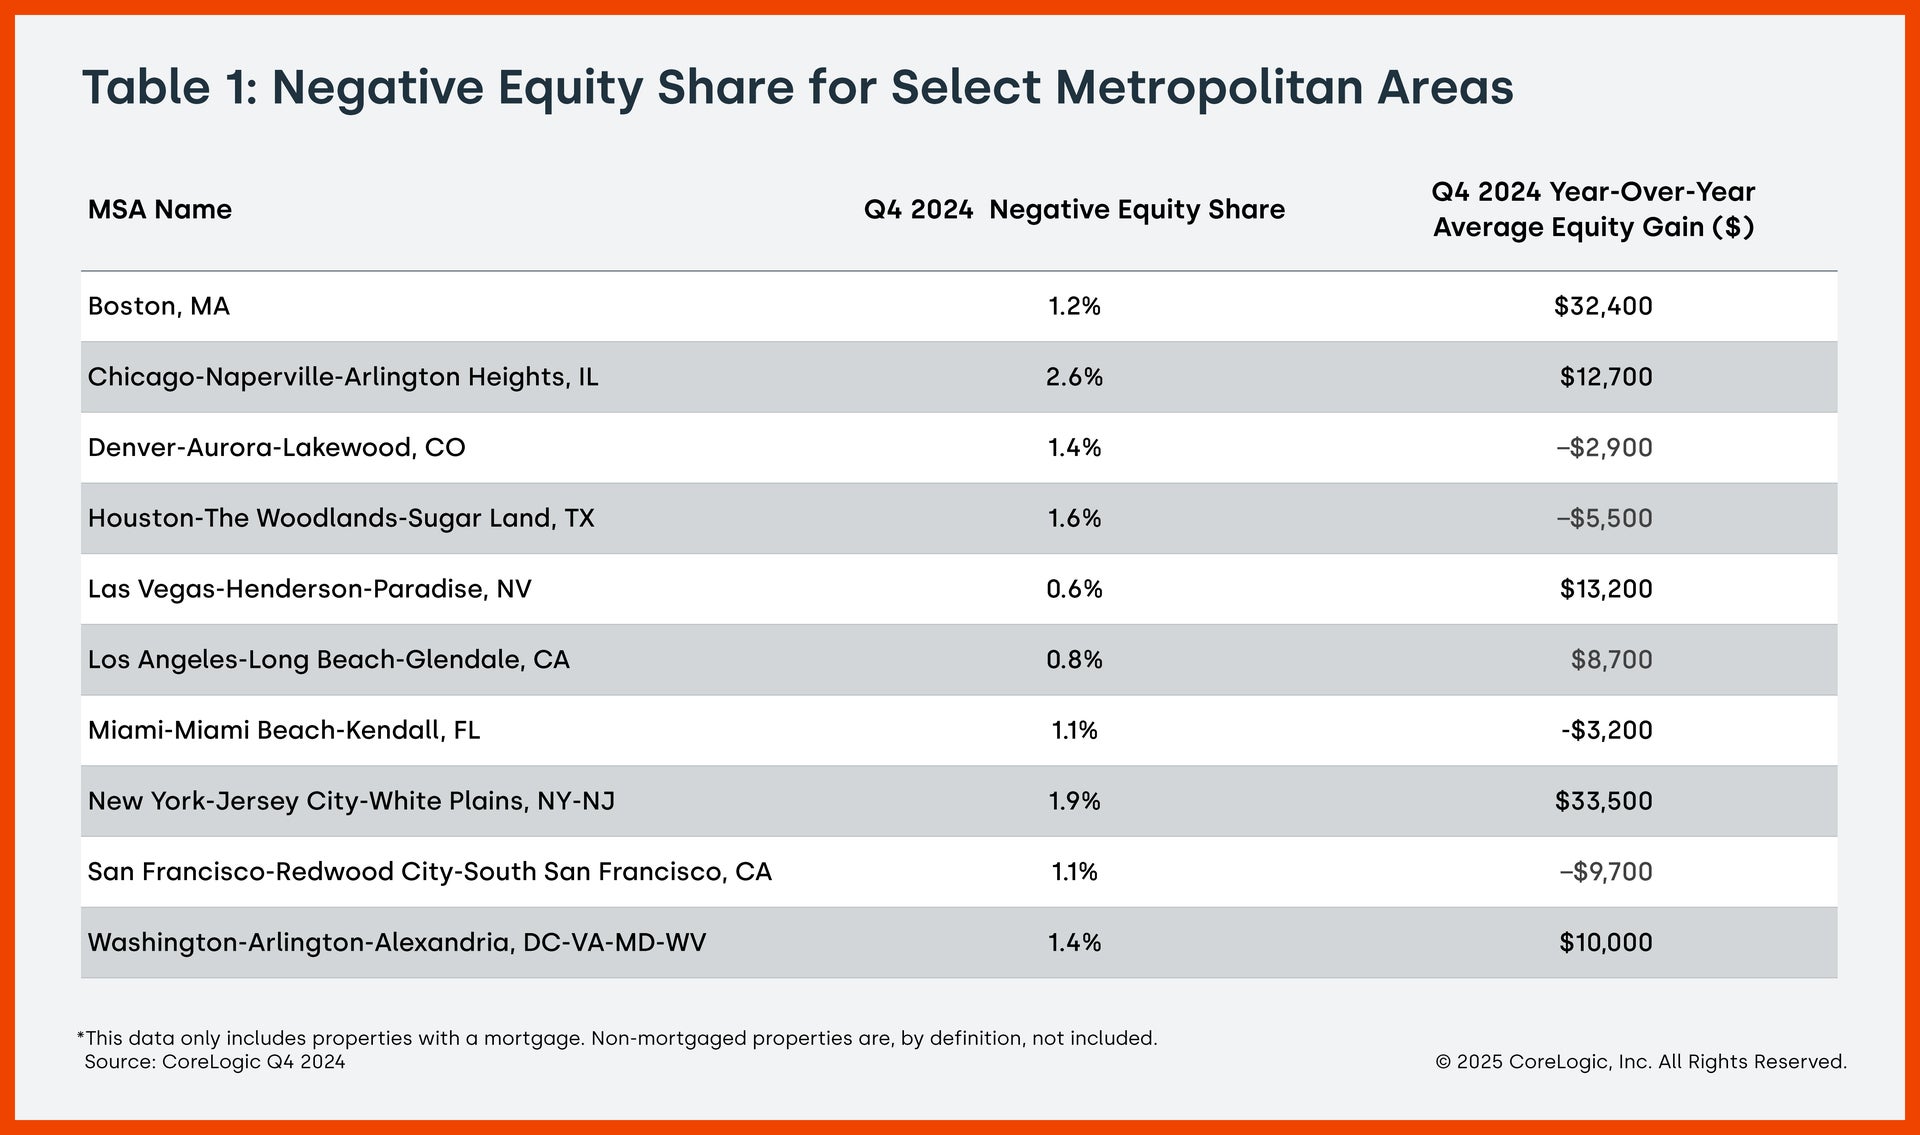
Still, amassing equity does not necessarily stave off the possibility of being underwater on a mortgage. In Chicago, average year-over-year equity gains were just north of $12,000 but 2.6% of properties reported negative equity. Nevertheless, past years of rapid growth have left many homeowners with a substantial accumulation of equity. This financial padding can serve as a backstop in the event of a relocation or job loss.
Housing equity growth slowed in 2024 versus 2020-2023 due to moderating price appreciation, but homeowners maintain substantial equity gains from prior years, preserving their strong financial position. Home prices continued to be the major driver of equity shifts and markets with declining prices generally saw fallen equity in 2024. In particular, a number of Florida’s markets, including Cape Coral, Sarasota, Lakeland and Tampa have experienced weakening prices over the past year, which led to Florida’s average equity declining by about $18,000 at the end of 2024. Thinking ahead, in light of mass government layoffs in Washington metro region, it is important to note that borrowers in the tri-state area have accumulated between $261,000 (in Maryland), $287,000 (in Virginia) and $353,000 (in Washington DC), in average home equity which will help as a financial buffer but also provide a downpayment in case of a move.
Negative equity, also referred to as underwater or upside-down mortgages, applies to borrowers who owe more on their mortgages than their homes are currently worth. Negative equity peaked at 26% of mortgaged residential properties in Q4 2009 based on CoreLogic equity data analysis, which began in Q3 2009.
The national aggregate value of negative equity was approximately $338 billion at the end of Q4 2024, up quarter over quarter by approximately $12.8 billion or 4 percent from $326 billion in Q3 2023. Year over year, it was also up by approximately $12.8 billion or 4 percent from $326 billion in Q3 of 2023.
The next CoreLogic Homeowner Equity Report will be released in June 2024, featuring data for Q4 2024. For ongoing housing trends and data, visit the CoreLogic Intelligence Blog: www.corelogic.com/intelligence.
Methodology
The amount of equity for each property is determined by comparing the estimated current value of the property against the mortgage debt outstanding (MDO). If the MDO is greater than the estimated value, then the property is determined to be in a negative equity position. If the estimated value is greater than the MDO, then the property is determined to be in a positive equity position. The data is first generated at the property level and aggregated to higher levels of geography. CoreLogic uses public record data as the source of the MDO, which includes more than 50 million first- and second mortgage liens and is adjusted for amortization and home equity utilization in order to capture the true level of MDO for each property. Only data for mortgaged residential properties that have a current estimated value are included. There are several states or jurisdictions where the public record, current value or mortgage data coverage is thin and have been excluded from the analysis. These instances account for fewer than 5% of the total U.S. population. The percentage of homeowners with a mortgage is from the 2019 American Community Survey. Data for the previous quarter was revised. Revisions with public records data are standard, and to ensure accuracy, CoreLogic incorporates the newly released public data to provide updated results.
Source: CoreLogic
The data provided is for use only by the primary recipient or the primary recipient’s publication or broadcast. This data may not be re-sold, republished or licensed to any other source, including publications and sources owned by the primary recipient’s parent company without prior written permission from CoreLogic. Any CoreLogic data used for publication or broadcast, in whole or in part, must be sourced as coming from CoreLogic, a data and analytics company. For use with broadcast or web content, the citation must directly accompany first reference of the data. If the data is illustrated with maps, charts, graphs or other visual elements, the CoreLogic logo must be included on screen or website. For questions, analysis or interpretation of the data, contact Charity Head at newsmedia@corelogic.com. For sales inquiries, please visit https://www.corelogic.com/support/sales-contact/. Data provided may not be modified without the prior written permission of CoreLogic. Do not use the data in any unlawful manner. This data is compiled from public records, contributory databases and proprietary analytics, and its accuracy is dependent upon these sources.
About CoreLogic
CoreLogic is a leading provider of property insights and innovative solutions, working to transform the property industry by putting people first. Using its network, scale, connectivity and technology, CoreLogic delivers faster, smarter, more human-centered experiences that build better relationships, strengthen businesses and ultimately create a more resilient society. For more information, please visit www.corelogic.com.
CORELOGIC and the CoreLogic logo are trademarks of CoreLogic, Inc. and/or its subsidiaries. All other trademarks are the property of their respective owners.
Media Contact
CoreLogic newsmedia@corelogic.com