


Press Release
February Annual Price Appreciation Slows Again, Up 3.9% YOY


IRVINE, Calif., April 29, 2025 – Cotality, a leading global property information, analytics, and data-enabled solutions provider, today released its latest findings on housing prices from the S&P CoreLogic Case-Shiller Home Price Index.
Although the housing market showed signs of growth this spring, they were short lived, and further improvements to the market this year may be challenging. March’s lower mortgage rates increased pending sales activity by about 12% year over year. However, mortgage rates surged in April, affecting consumer sentiment negatively with worries about personal finances, job prospects, and potential tariff impacts.
Despite these challenges, for-sale inventories have improved, particularly in the West, which has helped those markets see some gains in home sales activity. Southern California and North Carolina both saw upticks in existing home sales year to date. Among larger markets, Los Angeles leads with a 14% year-to-date jump in home sales. While some of Los Angeles’ increase may be due to the wildfires forcing affected families to find new shelter immediately, the metro’s homes sales activity was already improving in 2024 thanks to more supply across the region. Similarly, Oxnard, Anaheim, and San Jose saw better sales. North Carolina was another region with marked growth in 2025, with the cities of Durham and Winston-Salem ranking among the top markets for improved home sales. In contrast, many other markets saw slower home sales compared to last year, particularly in Florida and Texas, which remain near 20%+ below last year’s levels.
“Interestingly, February home prices jumped 0.4% from January, indicating stronger seasonal gains than seen pre-pandemic and highlighting the impact of January’s wildfires in the West. Price gains were particularly apparent in Los Angeles where home prices jumped three times faster this February than in previous years,” said Cotality’s Chief Economist Selma Hepp. “And while challenges will continue, the 2025 homebuying season has so far shown improving housing fundamentals. As mortgage rates move closer to 6%, homebuyers appear willing to step off the sidelines and take advantage of the larger inventories that give them the upper hand following years of difficult spring homebuying seasons. Lastly, home price changes continued to paint a story of bifurcating housing markets where we see stronger gains in the Northeast and the West while the South is experiencing slowing and declining prices.”
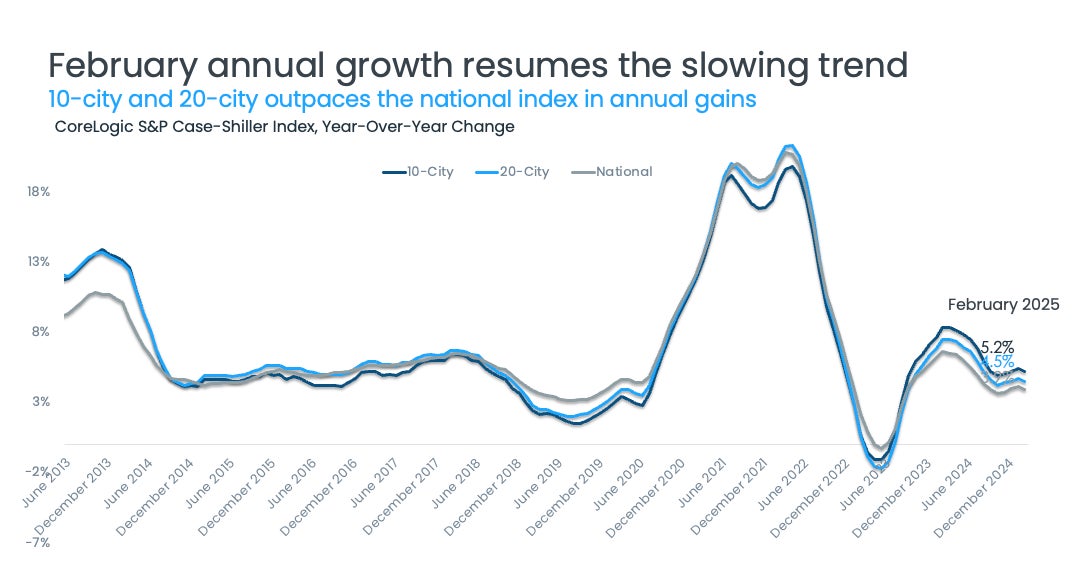
Regional trends in home sales activity resemble home price trends closely, and these trends indicate that slower home price appreciation is likely to continue. In February, the S&P Case-Shiller Index rose 3.9%. This continues the trend toward slower sales that started in 2024 and reverses the previous two months of increased appreciation, which mostly reflected the weak 2023 year-end (Figure 1).
The latest Cotality Home Price Index report forecasts slower home price gains through April before picking back up, but that uptick is in comparison with a mostly flat second half of 2024. Overall, appreciation for 2025 is expected to remain lower than in 2024, averaging about 3.2% nationally. Flattening home prices in the second half of 2024 highlight the impact of high mortgage rates and buyer fatigue which has slowed homebuying demand.
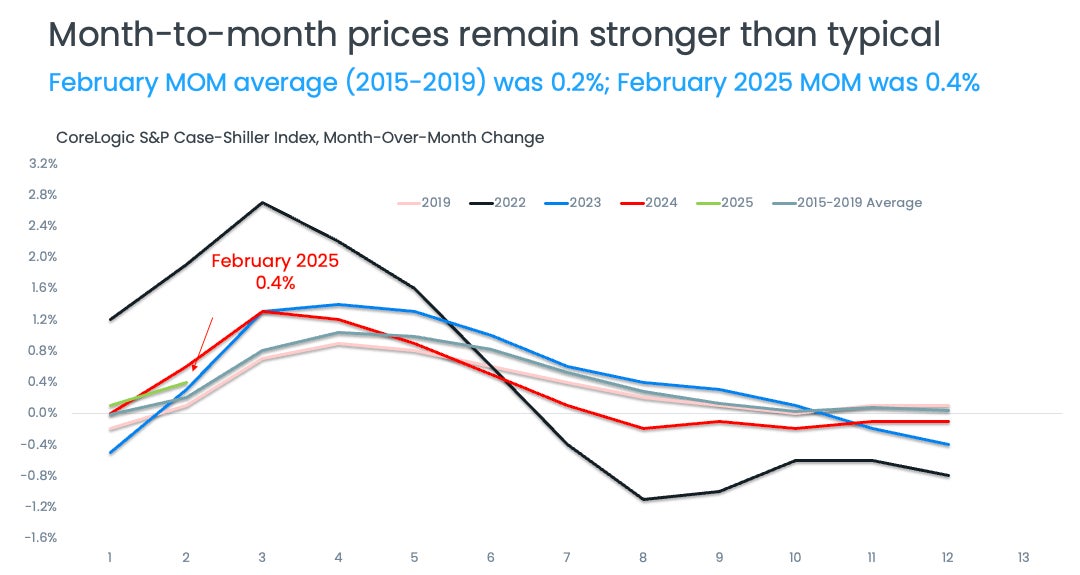
The non-seasonally adjusted, month-over-month index recorded a 0.4% increase in February, marking the second consecutive monthly increase after five prior months of small declines. The monthly change is above the average 0.2% increase recorded between 2015 and 2019, which may be driven by large positive increases seen in the Western markets (Figure 2).
The 10-city and 20-city composite indexes also slowed in February after a small uptick in January, with annual growth at 5.2% and 4.5%, respectively. This is down from the March 2024 peak when the 10-city composite index recorded 8.3% growth and the 20-city composite recorded 7.5% growth. Similarly to national index, the city composites haven’t changed notably from their September levels.
Compared with the 2006 peak, the national index is 76% higher, the 10-city composite index is 57% higher, and the 20-city composite 62% higher. Adjusted for inflation, the 10-city index is now 4% higher than its 2006 level and the 20-city index is up by 8% when compared with its 2006 high point. When adjusted for inflation, national home prices are 17% higher compared with 2006. Inflation-adjusted prices haven’t shown the same level of appreciation as nominal prices given elevated inflation in recent years. Recent Cotality analysis of U.S. metros also showed the geographically unequal impacts of inflation.
Data source: S&P CoreLogic Case-Shiller Indices, not seasonally adjusted (April 29, 2025 release)
Data source: S&P CoreLogic Case-Shiller Indices, not seasonally adjusted (April 29, 2025 release)
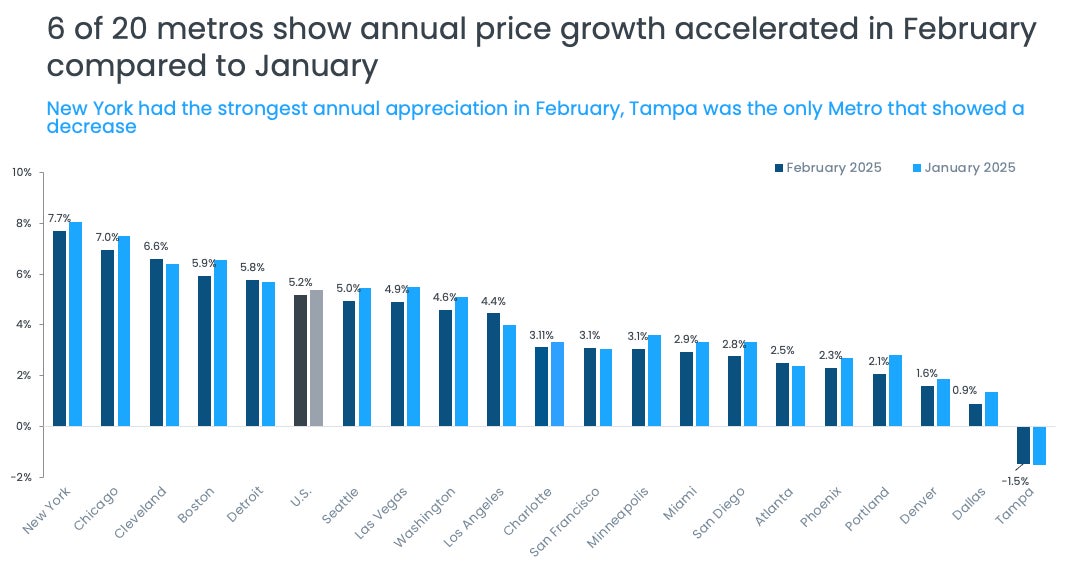
In February, 14 of the 20 metros saw slowing year-over-year price growth compared with the previous month (Figure 3). Portland posted the largest cooling in annual gains compared with the month before, followed by Boston and Las Vegas. In contrast, eight metros saw annual gains accelerate from the month before, led by Los Angeles.
New York, Chicago, and Cleveland led the 20-city index annual gains, with respective increases of 7.7%, 7.0%, and 6.6%. Nine metros saw annual price gains higher than the national 3.9% increase. Tampa, Florida remained the slowest markets in the 20-city index and the only one recording an annual decline of 1.1%.
Data source: S&P CoreLogic Case-Shiller Indices, not seasonally adjusted (April 29, 2025 release)
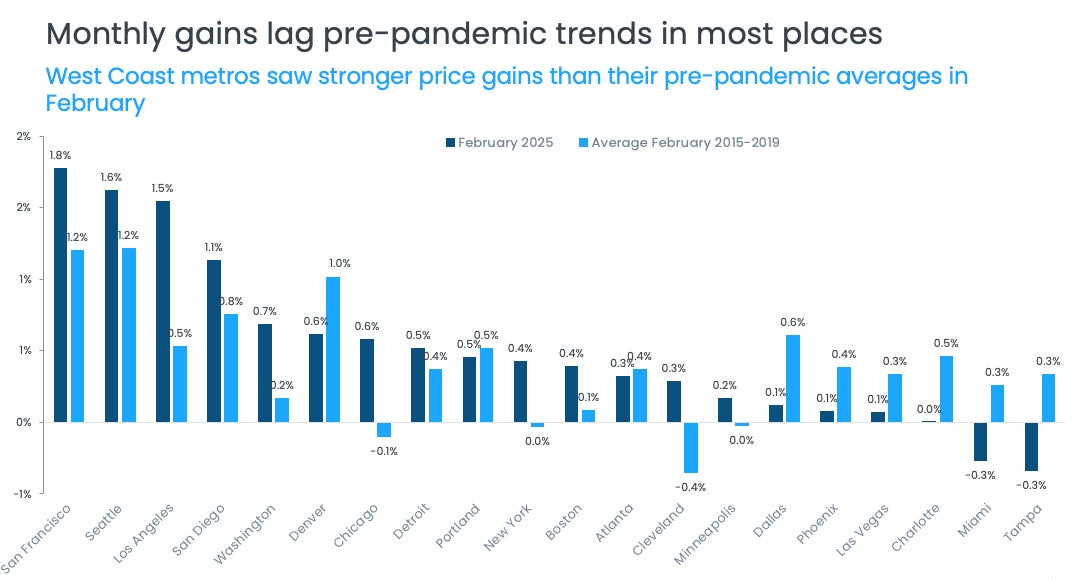
February national home prices recorded a 0.4% month-over-month increase, which was stronger than pre-pandemic trends. This was largely driven by strong increases in the West, particularly San Francisco, Seattle, and Los Angeles, but the figure also includes San Diego and Washington D.C. Some of the strong appreciation market leaders in the Midwest and the Northeast also continued to post relatively better gains than pre-pandemic, including Chicago, New York, and Boston.
In contrast, month-over-month home price declines were mostly in Florida where Miami and Tampa, both recorded 0.3% declines from the month prior. Figure 5 summarizes the current year’s monthly changes in February compared with averages recorded between 2015 and 2019.
Data source: S&P CoreLogic Case-Shiller Indices, not seasonally adjusted (April 29, 2025 release)
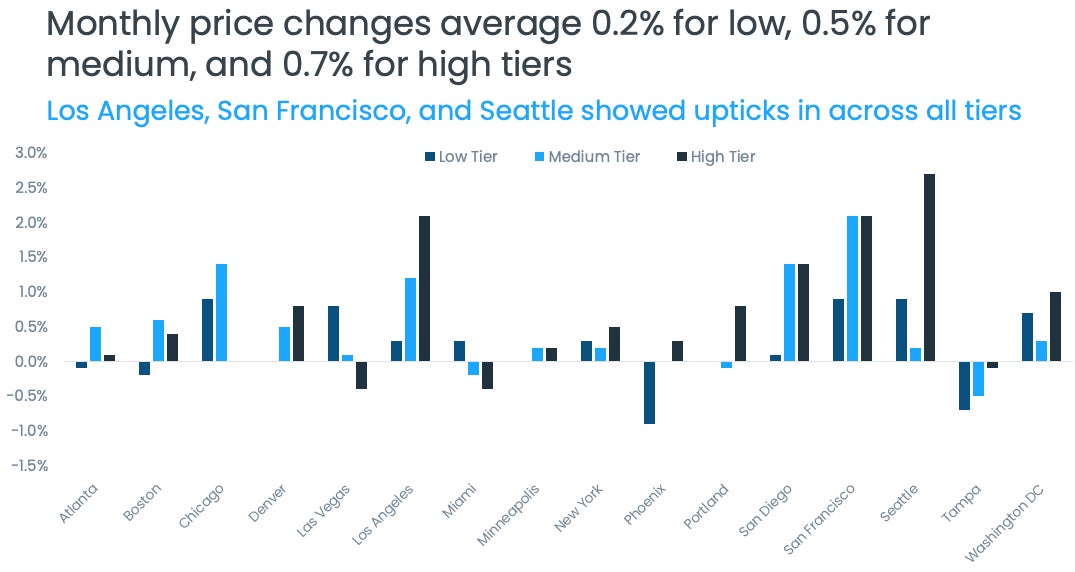
The month-over-month comparison of appreciation by price tier and location also reveals relative changes in demand across the country. In February, home prices were generally up across metros and price tiers. The exception was Tampa where home price changes stayed negative in all price tiers.
High-tier prices jumped 0.7% on average across metros while middle-tier prices increased 0.5%. The low tier had an average increase of 0.2%. Strong high-tier gains were pushed up by significant increases in upper tier pricing in Los Angeles, Seattle, and San Francisco. And while high-tier pricing in Los Angeles could be showing the impact of wildfires in the region that occurred in January, it is not clear that Seattle was impacted by Los Angeles events (Figure 5).
Data source: S&P CoreLogic Case-Shiller Indices, not seasonally adjusted (April 29, 2025 release)
While challenges will persist for homebuyers and sellers, the 2025 homebuying season has so far revealed that housing fundamentals are indeed improving. With each move closer to a 6% mortgage rate, homebuyers appear willing to step off the sidelines. In addition, inventory gains are also offering a significant rebalance between buyers and sellers, giving buyers a stronger position after a number of difficult spring homebuying seasons.
Nevertheless, February’s strong home price gains illustrated by the S&P CoreLogic Case-Shiller Home Price Index should not be taken as a general indication of the strength of home price appreciation this spring. The index heavily weights markets, such as Los Angeles, where home prices have been impacted by the wildfires and demand for higher-priced homes.
As many other markets across the country continue to illustrate, the pressure of elevated non-fixed homeownership costs — such as insurance and taxes — will continue to weigh down many southern and southeastern markets. Additionally, the continued market bifurcation may mean very different trends will emerge across the U.S. and cause home prices to follow divergent paths.
###
About Cotality
Cotality accelerates data, insights, and workflows across the property ecosystem to enable industry professionals to surpass their ambitions and impact society. With billions of real-time data signals across the life cycle of a property, we unearth hidden risks and transformative opportunities for agents, lenders, carriers, and innovators. Get to know us at www.cotality.com.
Media Contact
Charity Head
Cotality