


Press Release
Home equity growth stalls amid modest home price increase


- The average U.S. homeowner lost approximately $9,200 in equity during the past year, but that still leaves the average borrower with about $307,000 in accumulated home equity.
- Total homeowner equity for borrowers with a mortgage totaled $17.5 trillion in the second quarter of 2025.
- As home prices dip in the District of Columbia and Florida, these markets saw the largest annual equity declines, down $34,000 and $32,000, respectively.
- The number of homes in negative equity increased year over year by 18% to 1.15 million homes.
IRVINE, Calif., September 12, 2025 — Cotality, a leading global property information, analytics and data-enabled solutions provider, today released the Homeowner Equity Report (HER) for the second quarter of 2025. The report reveals a mixed picture of homeowner equity gains across the United States.
“The average borrower equity is approximately $307,000, representing the third highest figure in recorded history and an increase of $124,000 compared to the first quarter of 2020 at the start of the pandemic. Even in markets where recent price declines have pulled down average equity, such as the District of Columbia and Florida, borrowers on average hold almost $350,000 and $290,000 in equity, respectively,” said Dr. Selma Hepp, Cotality chief economist.
Borrower equity decreased year over year, declining by $141.5 billion or 0.8%. That decline moves overall net equity to $17.5 trillion for homeowners with a mortgage. Still, recent declines are not enough to shave off the gains that homeowners have seen over the last few years.
Nevertheless, homeowners should pay attention to the moderating market, however small the cuts. After gaining $25,000 in 2023 and another $4,500 in 2024, recent equity gains have stalled. Year over year, homeowners across the U.S. lost an average of $9,200 in equity.
Those losses have increased the share of mortgaged homes with negative equity from 1.7% to 2% year over year. Put differently, an 18% year-over-year rise in negative equity has pushed 175,000 more homes into the category, there are clear signals of challenges ahead.
However, viewed from a quarterly perspective, the number of homes with negative equity decreased by 3.3%. This seasonal improvement coincides with the spring homebuying season when prices are typically on an upward trajectory.
Still, the share of homeowners with negative equity is inching closer to the Q2 2024 historic low of 1.7%. The share of homes in negative equity is unlikely to change much over the next year. Current data shows that 144,000 properties would regain equity if home prices rose 5%, but 242,000 would fall into negative equity if prices fall 5%. However, the Cotality Home Price Index is forecast to increase by about 3% by June 2026.
“Home prices this year have experienced the slowest rate of growth since the Great Financial Crisis of 2008. As appreciation remains modest and even declines in some markets, home equity accumulation is projected to follow suit. With the reduced pace of appreciation, seasonal fluctuations in home prices will have a pronounced impact on equity changes. Recent declines also highlight the benefits of accessible equity as some homeowners leveraging their equity for alternative financial purposes,” continued Hepp.
Homeowners in the Northeast continue to see their equity rise as home prices in the region remain on a steady incline. Connecticut ($37.4K), New Jersey ($36.2K), and Rhode Island ($31.2K) saw the largest gains year over year. In contrast, 32 states posted annual equity losses. The top three states to lose equity were the District of Columbia ($-34.4K), Florida ($-32.1K), and Montana ($-26.9K).
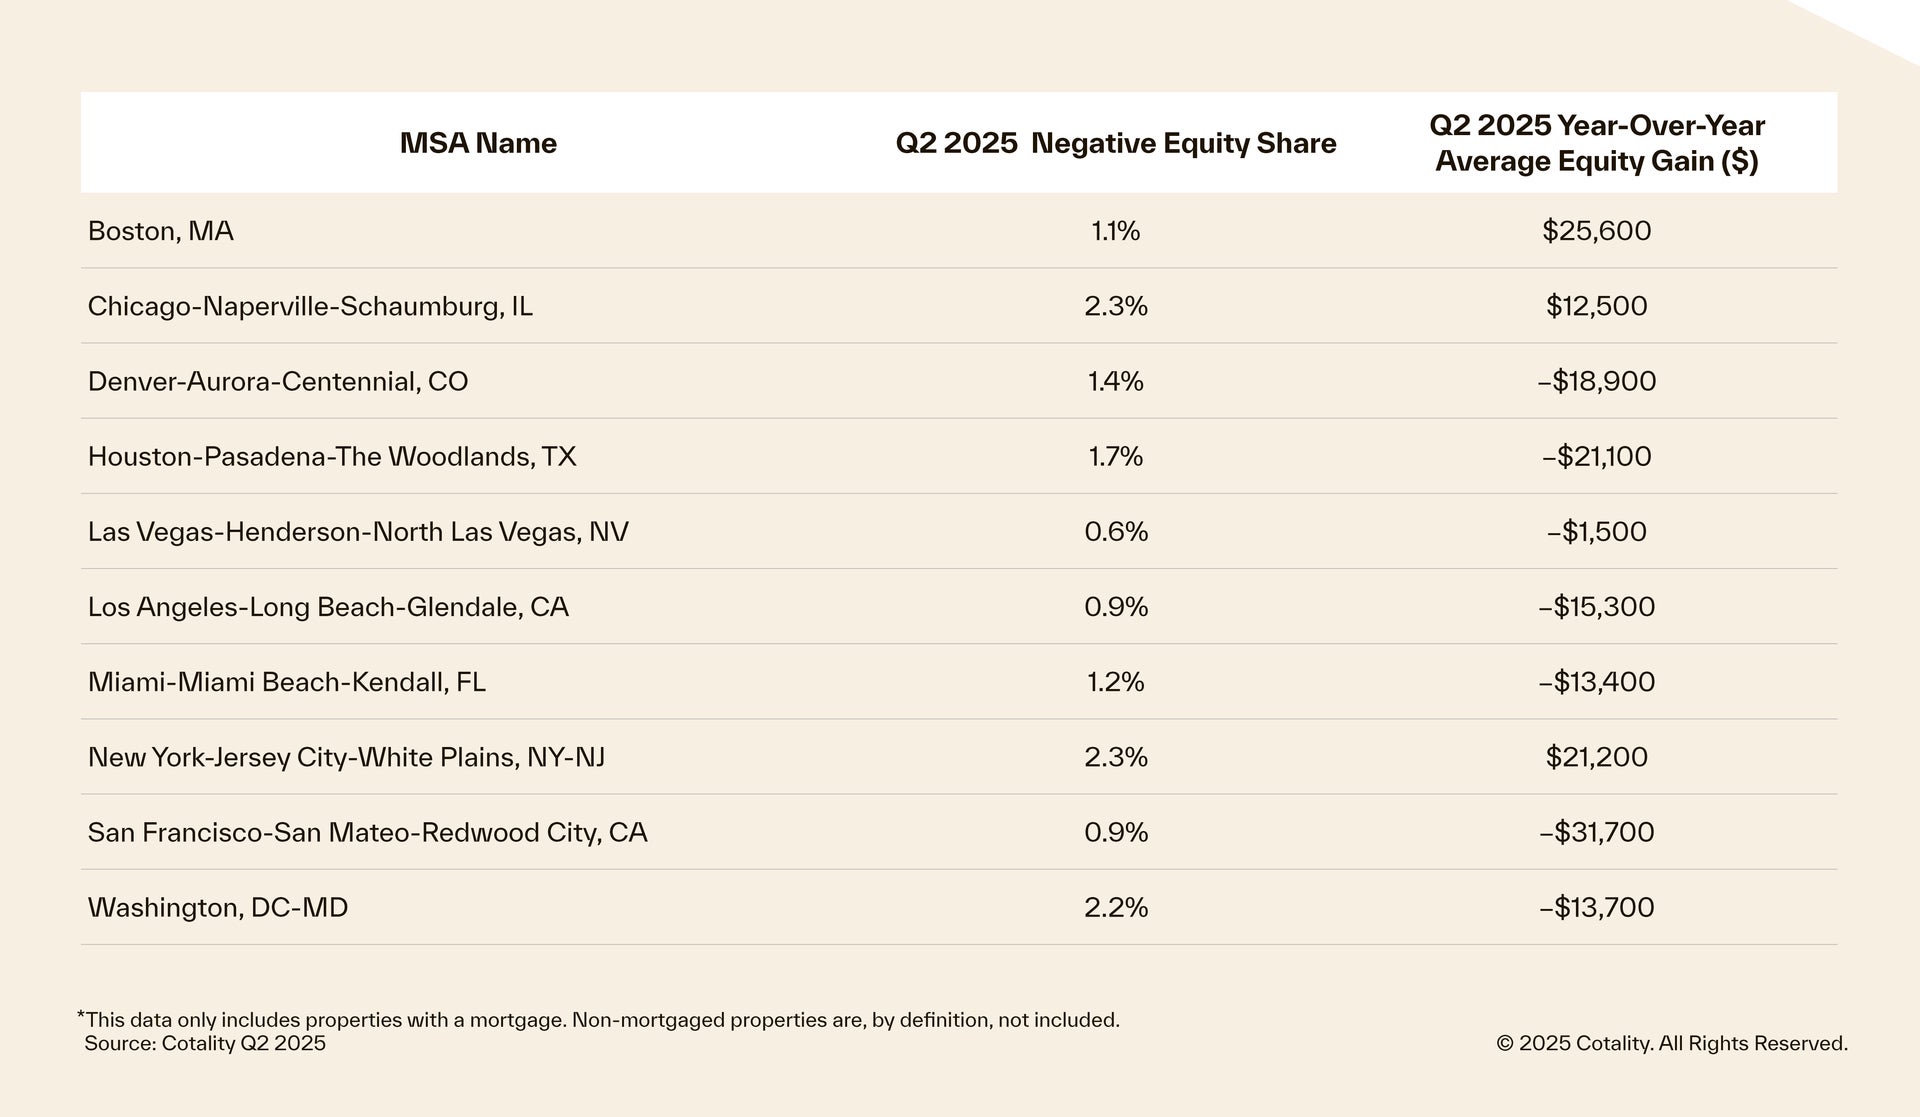
Cotality provides homeowner equity data at the metropolitan level. In Table 1, 10 of the largest cities, by housing stock, are depicted. While negative equity has seen an increase nationally, Las Vegas, NV; Los Angeles and San Francisco are the least challenged. Markets that have seen large increases in negative equity shares include McAllen, TX; Shreveport, LA; Cape Coral, FL; and Ocala, FL – all areas where home prices have fallen or have seen more natural disasters that have wiped out borrowers’ equity.
The next Cotality Homeowner Equity Report will be released December 11, 2025, featuring data for Q3 2025. For ongoing housing trends and data, visit the Cotality Insights Blog: www.cotality.com/insights.
Figure 1: Map of average year-over-year equity gain per borrower
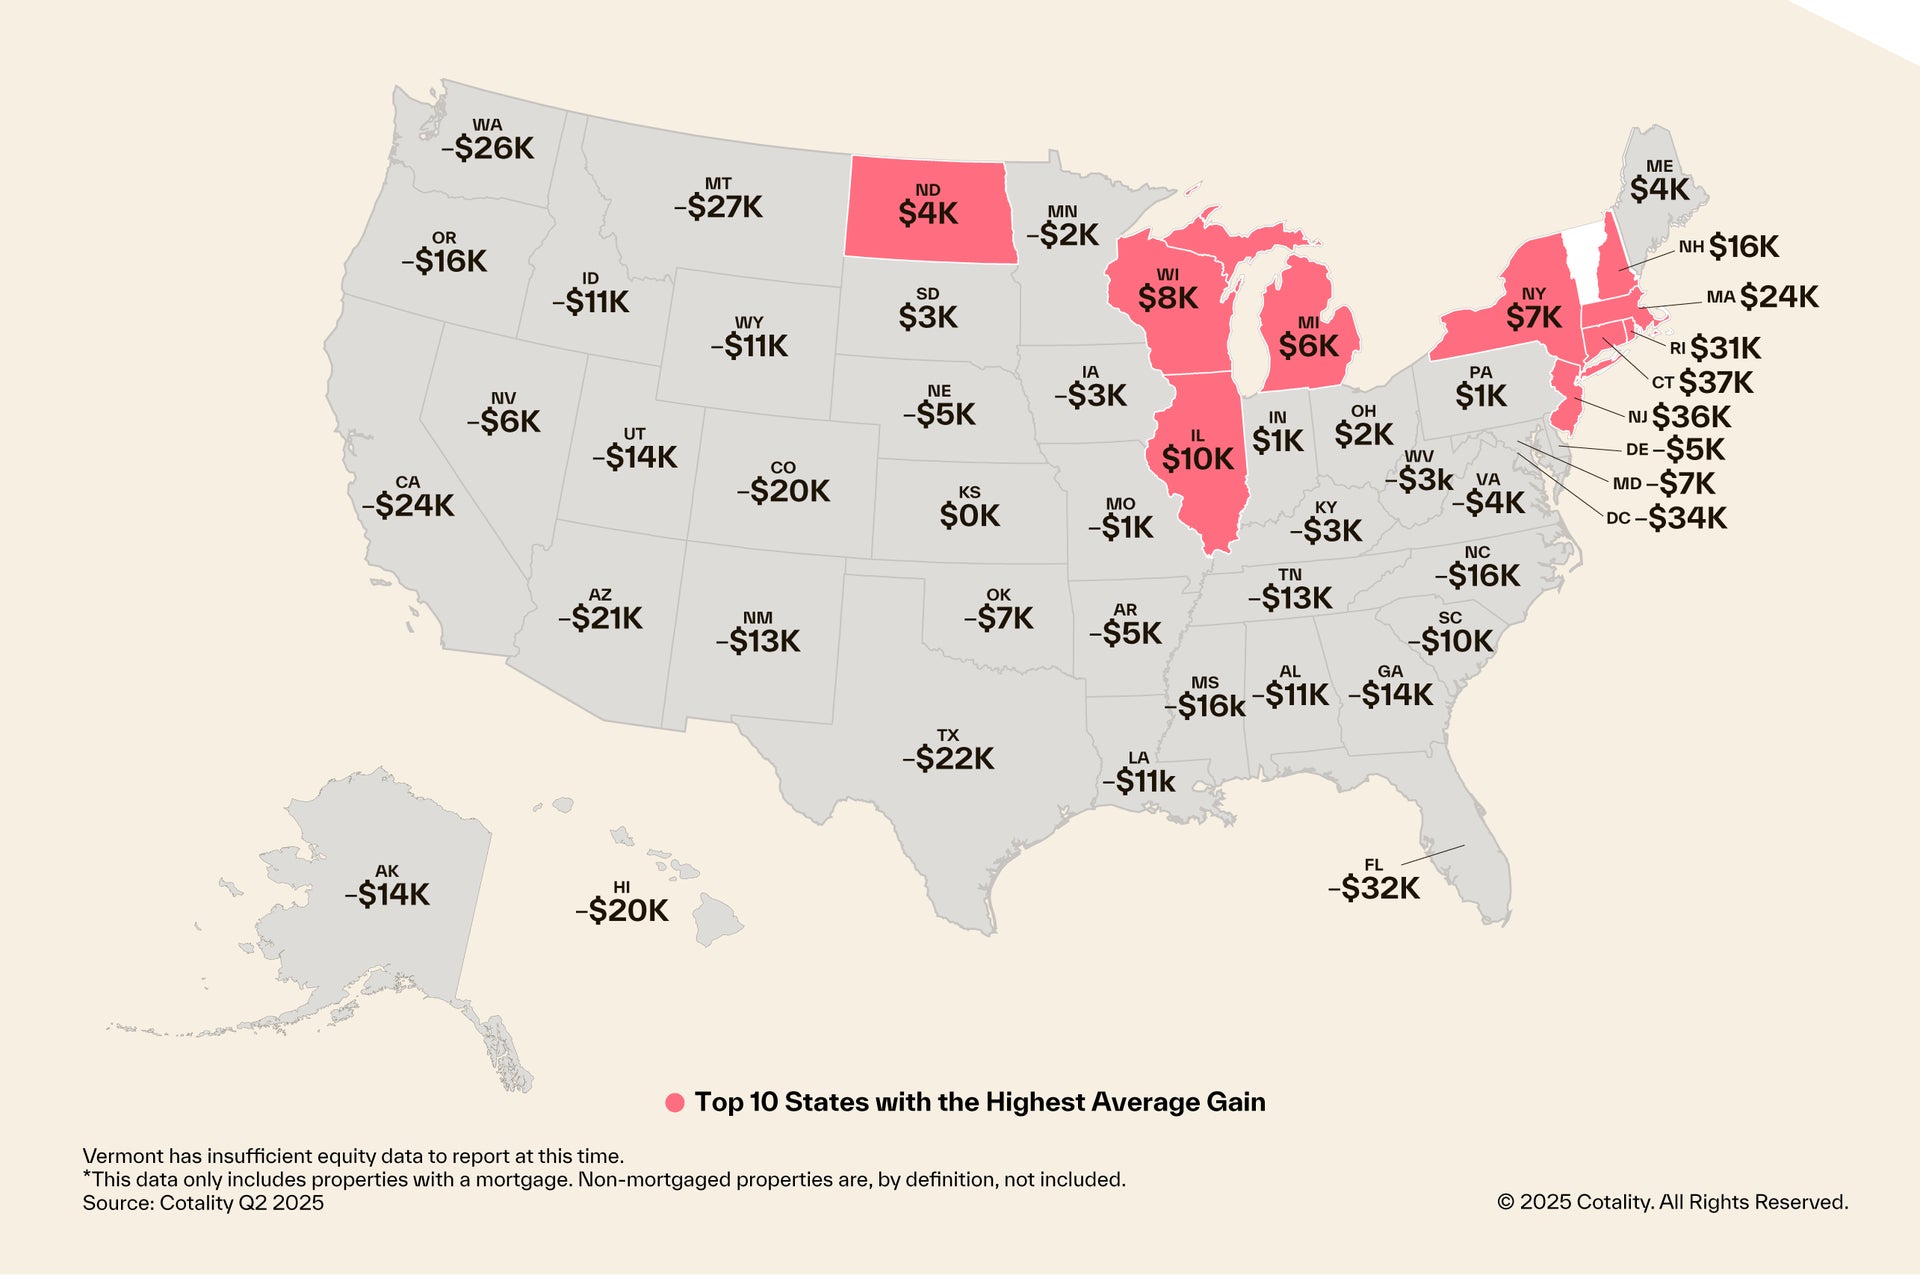
Figure 2: National home equity distribution by LTV segment
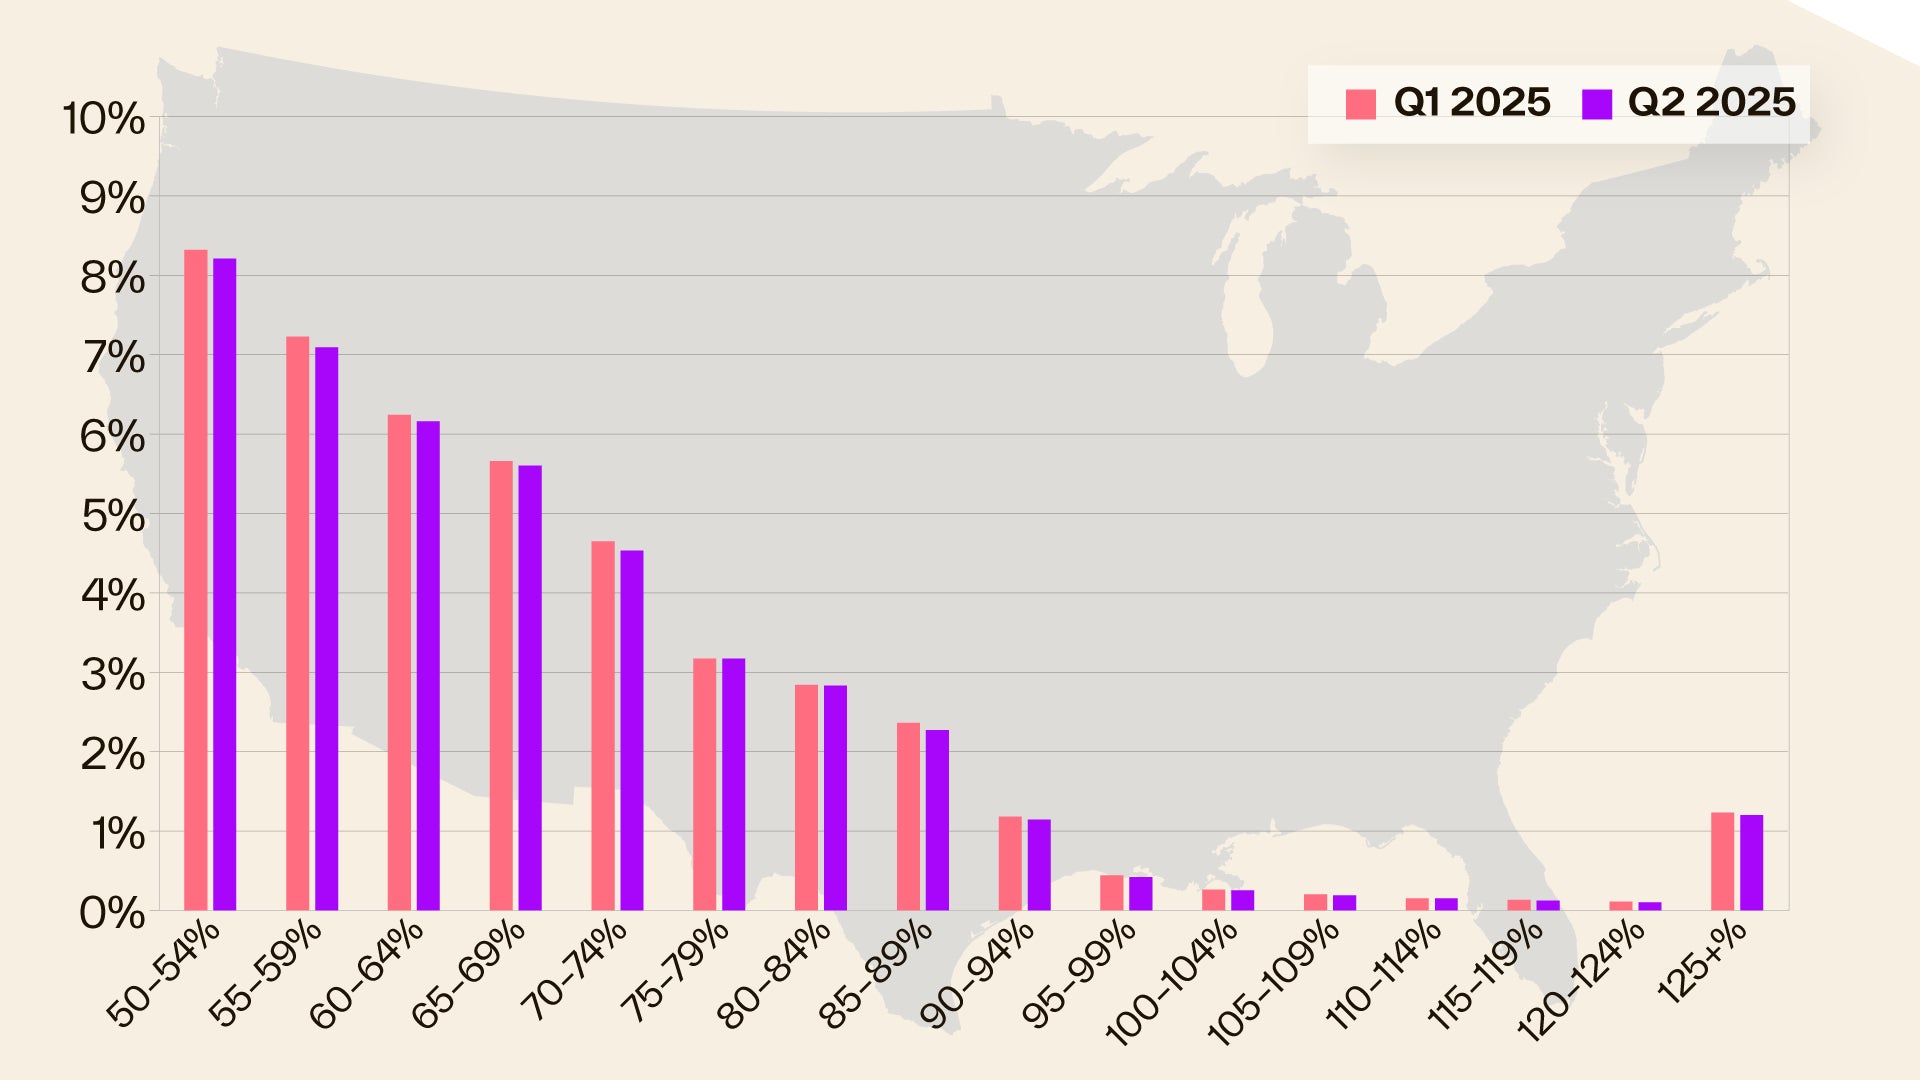
Table 1: Negative equity share for select metropolitan areas
Methodology
The amount of equity for each property is determined by comparing the estimated current value of the property against the mortgage debt outstanding (MDO). If the MDO is greater than the estimated value, then the property is determined to be in a negative equity position. If the estimated value is greater than the MDO, then the property is determined to be in a positive equity position. The data is first generated at the property level and aggregated to higher levels of geography. Cotality uses public record data as the source of the MDO, which includes more than 50 million first- and second mortgage liens and is adjusted for amortization and home equity utilization in order to capture the true level of MDO for each property. Only data for mortgaged residential properties that have a current estimated value are included. There are several states or jurisdictions where the public record, current value or mortgage data coverage is thin and have been excluded from the analysis. These instances account for fewer than 5% of the total U.S. population. The percentage of homeowners with a mortgage is from the 2019 American Community Survey. Data for the previous quarter was revised. Revisions with public records data are standard, and to ensure accuracy, Cotality incorporates the newly released public data to provide updated results.
Source: Cotality
The data provided is for use only by the primary recipient or the primary recipient’s publication or broadcast. This data may not be resold, republished, or licensed to any other source, including publications and sources owned by the primary recipient’s parent company, without prior written permission from Cotality. Any Cotality data used for publication or broadcast, in whole or in part, must be sourced as coming from Cotality, a data and analytics company. For use with broadcast or web content, the citation must directly accompany the first reference of the data. If the data is illustrated with maps, charts, graphs, or other visual elements, the Cotality logo must be included on screen or website. For questions, analysis, or interpretation of the data, contact newsmedia@cotality.com. Data provided may not be modified without the prior written permission of Cotality. Do not use the data in any unlawful manner.
About Cotality
Cotality accelerates data, insights, and workflows across the property ecosystem to enable industry professionals to surpass their ambitions and impact society. With billions of real-time data signals across the life cycle of a property, we unearth hidden risks and transformative opportunities for agents, lenders, carriers, and innovators. Get to know us at www.cotality.com.
Media Contact
Charity Head
Cotality