Overview
- Fastest 40-year decline: Combined capital city home values fell 8.1% over seven straight months, sitting just 0.1% shy of the 40-year record peak-to-trough drop of 8.2%.
- Downturn in two phases: Melbourne (-7.8%) and Sydney (-10.1%) entered the cycle first, but Melbourne's pace of decline has noticeably moderated.
- Mid-sized capitals hit record speed: Perth (-8.9%), Brisbane (-8.3%), and Adelaide (-4.4%) are now experiencing their fastest downturn on record.

Mid-sized capitals driving Australia’s fastest property downturn in four decades
Home values across Australia’s combined capital cities fell for the seventh consecutive month in October, taking cumulative losses to 8.1%, the fastest decline recorded in more than 40 years.
The sharp drop leaves the housing market just 0.1 percentage point shy of the largest peak-to-trough decline seen in the past four decades.
Cotality’s Head of Research, Gerard Burg noted that the current cycle could soon eclipse that benchmark.
“The largest peak-to-trough downturn at least over past 40 years across the combined capital cities was 8.2% between October 2017 and May 2019. Next month, the current downturn looks set to surpass this fall.”
Downturn phases
Mr Burg explained how the downturn progressed through stages across the major capitals.
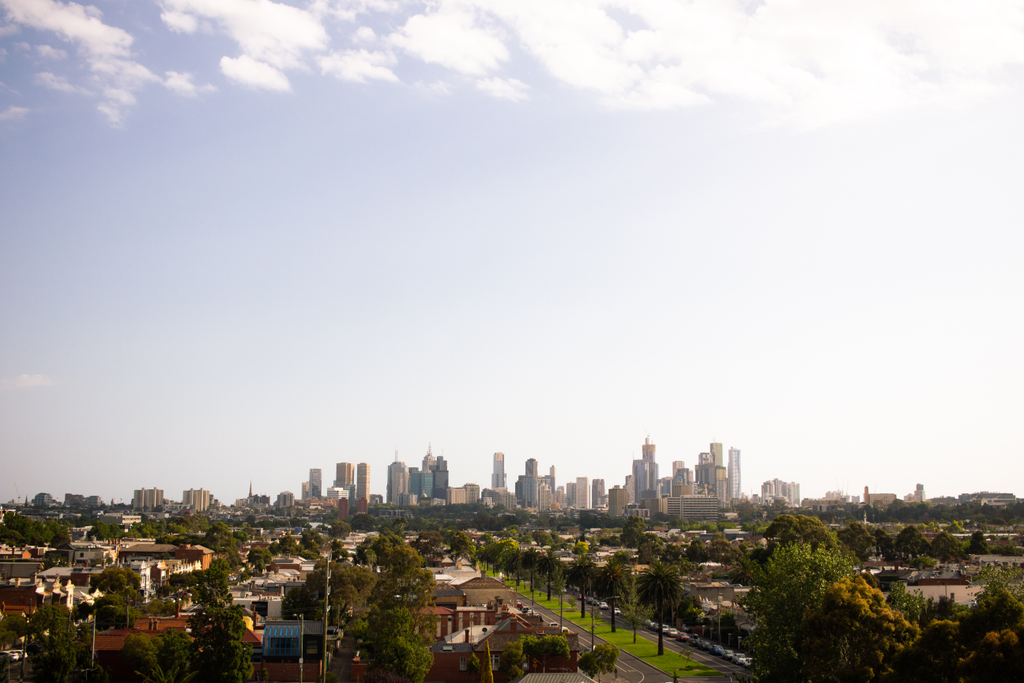
“Melbourne and Sydney led the early stages first of the downturn, peaking in November ’25 and February ’26 respectively.
“Melbourne values have fallen 7.8% since their November peak, pulling back at a noticeably slower pace than during previous episodes such as the 2017-19 and 1989-92 cycles.”
“Meanwhile, Sydney has recorded the largest drop, down 10.1% from its market peak to the end of October. In contrast to earlier cycles, Sydney’s downturn is tracking marginally faster than the 2022–23 declines.”
Shifting gears
While the initial phase was defined by the larger capitals, the second phase has seen market momentum shift gears.
Mr Burg highlighted that the nation’s most resilient mid-sized capitals are now seeing an unprecedented pace of decline.
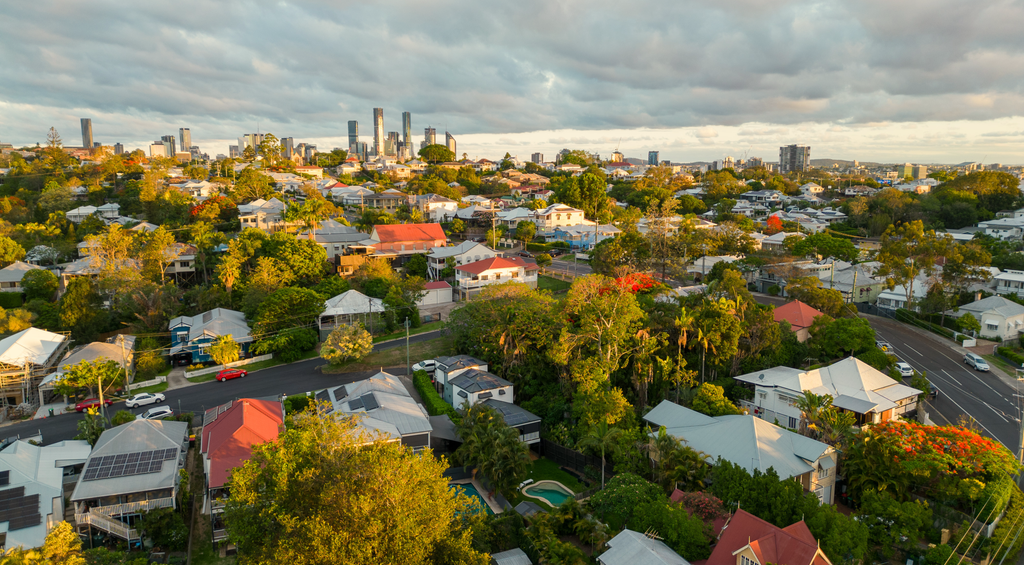
“In cumulative terms, Perth has followed closely behind Sydney to record the country’s second-largest decline to date, down -8.9% from its peak. Brisbane has also seen steep falls of -8.3%, while Adelaide is down -4.4%.”
“These mid-sized capitals are now experiencing their fastest downturn on record. Strong growth in home values in these markets post-COVID substantially stretched affordability metrics, increasing the demand-side pressures associated with rate hikes this year,” he said.
By contrast, conditions across the remainder of the country have remained relatively measured.
“Combined regional markets have seen values pull back by just -3.1% from their peak, tracking at a much slower and milder pace than previous downturns, while signs of a downturn in Darwin and Hobart are yet to fully emerge.” added Mr Burg.
Where to from here?
Looking ahead, Mr Burg noted that the supply side of the market is beginning to show early signs of adjustment.
The total stock available for sale in Melbourne sat 5.3% below the five-year average in the four weeks to 8 November, compared with 25.1% above average in Adelaide, 24.4% above average in Brisbane and 8.0% above average in Perth.
“A better balance between available supply and demand in Melbourne means home values in the city are falling at the slowest pace of the major capitals. A similar transition in other cities should eventually slow the declines elsewhere,” he said.
“A recovery in housing market conditions is unlikely until buyers have the confidence and financial capacity to return to the market.
“Affordability and investor policies are likely to remain constraints, meaning it is likely that rate cuts from the Reserve Bank will be necessary, which currently appears unlikely before the second half of 2027,” he concluded.
Key highlights from the Cotality Housing Chart Pack, November 2026
- Chart of the Month: The current housing downturn is unfolding at a historically rapid pace. Capital-city home values have fallen 8.1% in seven months, marking the fastest comparable housing decline in at least 40 years.
- At $11.9 trillion, housing is worth more than Australia's superannuation and share markets combined and accounts for over half (55.8%) of household wealth.
- National dwelling values fell 3.9% over the quarter and 2.8% over the year to October 2026.
- The combined capitals underperformed regional markets. Capital-city values fell 4.8% annually, while regional values rose 3.4%.
- Annual sales volumes fell 11.2% nationally, with weaker performance in the combined capitals than in regional areas.
- Selling conditions softened as homes took longer to sell and vendor discounts continued to widen for the eighth consecutive month, reaching 4.5%.
- New listings remained below average through spring, roughly 13.9% lower than a year earlier and 15.7% below the 5-year average.
- The median time on market increased to 41 days nationally over the three months to October.
- Auction conditions weakened further, with the four-week average clearance rate falling to its lowest level since May 2020.
- Annual rental growth moderated to 5.3% nationally, although regional rental growth continued to outpace the capitals.
- Gross rental yields increased as dwelling values declined and rents continued to rise, with the national yield at 3.9%.
- The RBA increased the cash rate for the fifth time this year in November, raising it by 25 basis points to 4.85%.
- Borrowing costs continued to rise in September, with variable rates reaching 6.22% for owner-occupiers and 6.41% for investors.