Overview
- Since September last year, lower-priced homes – that is those under the expanded Home Guarantee Scheme price caps - have generally recorded stronger growth than higher-priced homes.
- Growth in home values has diverged based on whether properties fall under or above the scheme’s price caps.

New analysis from Cotality shows that since September last year, lower-priced homes – that is those under the expanded Home Guarantee Scheme price caps - have generally recorded stronger growth than higher-priced homes. Growth in home values has diverged based on whether properties fall under or above the scheme’s price caps.
Month on month change in dwelling values, Australia
Properties with a value estimate above and below the first home buyer 5% deposit guarantee price caps
Change in dwelling values
December quarter 2025
Quarterly Growth Trends
- Homes under the price cap: +3.6% in the December quarter
- Homes above the price cap: +2.4% in the same period
“The expanded 5% deposit guarantee has sharpened demand at lower price points, with under‑cap markets outperforming across almost nine‑in‑ten regions,” commented Tim Lawless, Cotality’s research director.
“We’re seeing a clear shift in momentum, with buyers increasingly targeting homes that fall under the new price caps—especially in Sydney, where the value gap is most pronounced.”
“This trend was already visible before the scheme’s official start on October 1, suggesting some buyers acted early to secure properties before competition increased.”
Possible Drivers
Several factors may explain the stronger growth at lower price points:
- Demand ’brought forward’: Anticipation of increased competition and price pressure after the scheme’s launch has likely brought forward demand from those who didn’t necessarily need to rely on the deposit guarantee.
- Serviceability constraints: A trend towards higher home values amid elevated interest rates and serviceability limits may be pushing demand toward lower-priced, more affordable properties.
- Investor activity: Increased investor presence in the lower price segment, competing with first-home buyers and mainstream demand. Investors comprised 41% of mortgage demand in Q3, and annual investor credit growth is rising at the fastest rate since December 2015.
Regional Differences
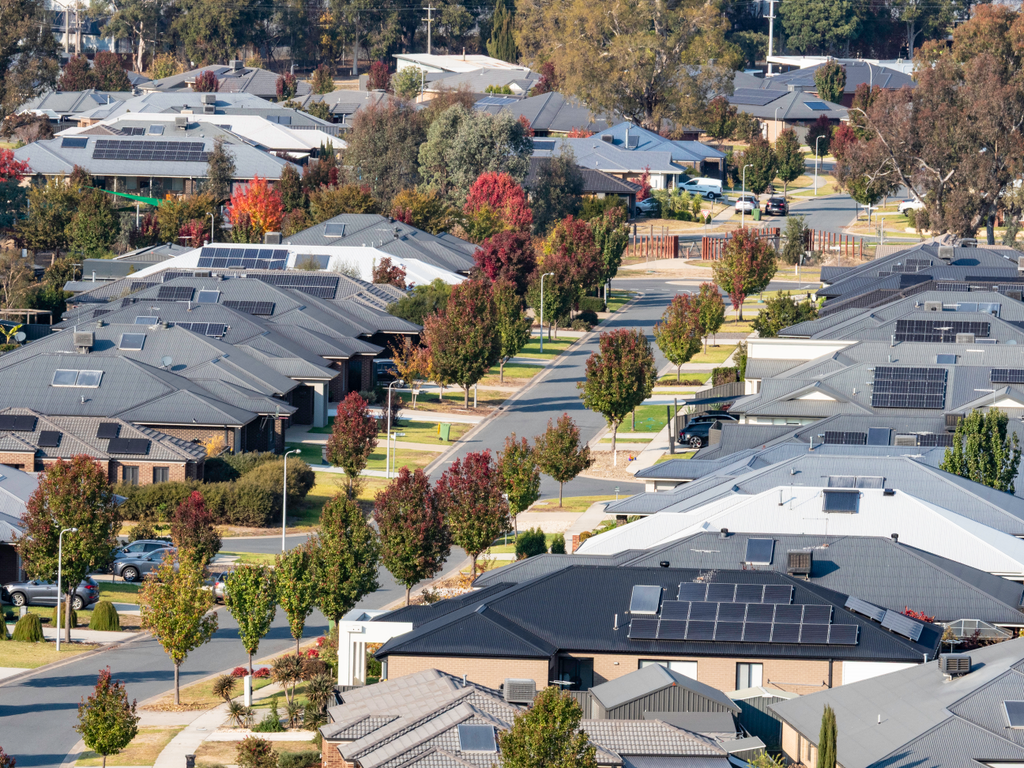
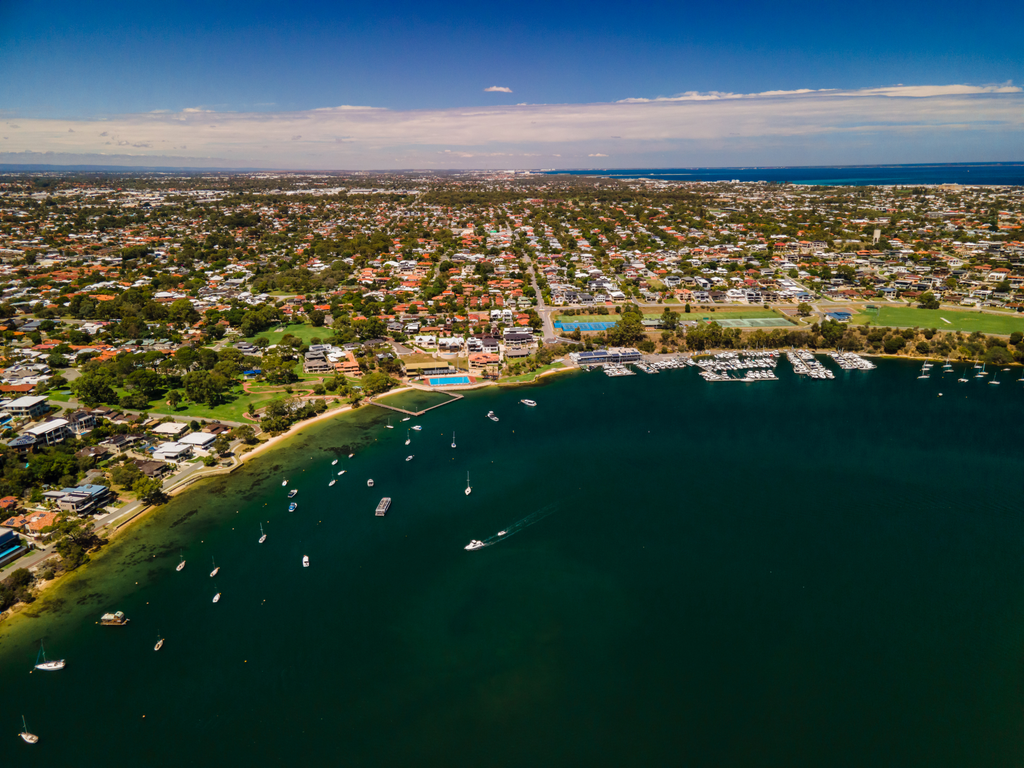
The pattern of stronger growth at values below the price caps is consistent across every capital city and regional market except the ACT.
- Sydney: The largest value growth differential was recorded across Australia’s largest city. Homes with a value under the cap rose 2.3%, while those above the cap fell 0.1% during the December quarter.
- Across Australia, 89% of SA4-sub regions have shown a stronger growth rate for properties with a value under the price caps. 78 out of 88 regions analysed showed stronger growth for homes under the cap.
Overall, the expanded deposit guarantee appears to have amplified demand for lower-priced homes, contributing to faster growth in this segment compared to higher-priced properties.