Overview
- The federal government's fast-tracked Home Guarantee Scheme is about to boost options for first home buyers, with the number of qualifying markets set to almost double.
- Under the old price caps, around a third of markets analysed nationally had a median value below the respective limits, but under the new rules, this portion is set to jump to 63.1%.
- Nationally, just over half of house markets (51.6%) will fall under the new price caps, while 93.7% of unit markets will qualify.

The fast-tracked expansion of the federal government's Home Guarantee Scheme, effective from October 1, is set to significantly increase the range of suburbs available to first home buyers, according to Cotality’s September Monthly Housing Chart Pack.
The scheme, which allows eligible first home buyers to avoid lenders mortgage insurance while purchasing a home with a 5% deposit, will now remove income and place limits, while also raising property price caps across most regions.
Under the old price caps, around a third of the 4,848 house and unit markets analysed nationally had a median value below the respective limits.
Under the expanded limits, this portion jumps to 63.1%, including 51.6% of house markets and 93.7% of unit markets.
Cotality Economist Kaytlin Ezzy says the new settings will empower first home buyers with greater choice, while helping to level the playing fields for those without access to the bank of mum and dad.
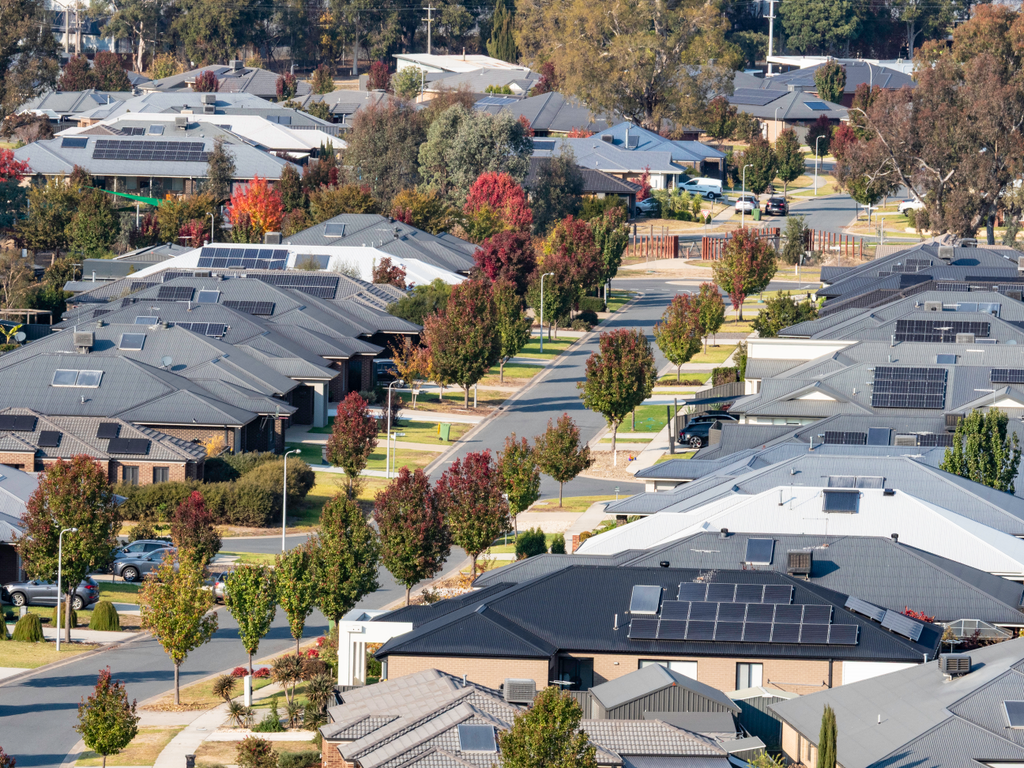
“Previously, to qualify for the scheme, first home buyers were largely restricted to more affordable housing options, including units and houses in outer mortgage belts and regional markets”.
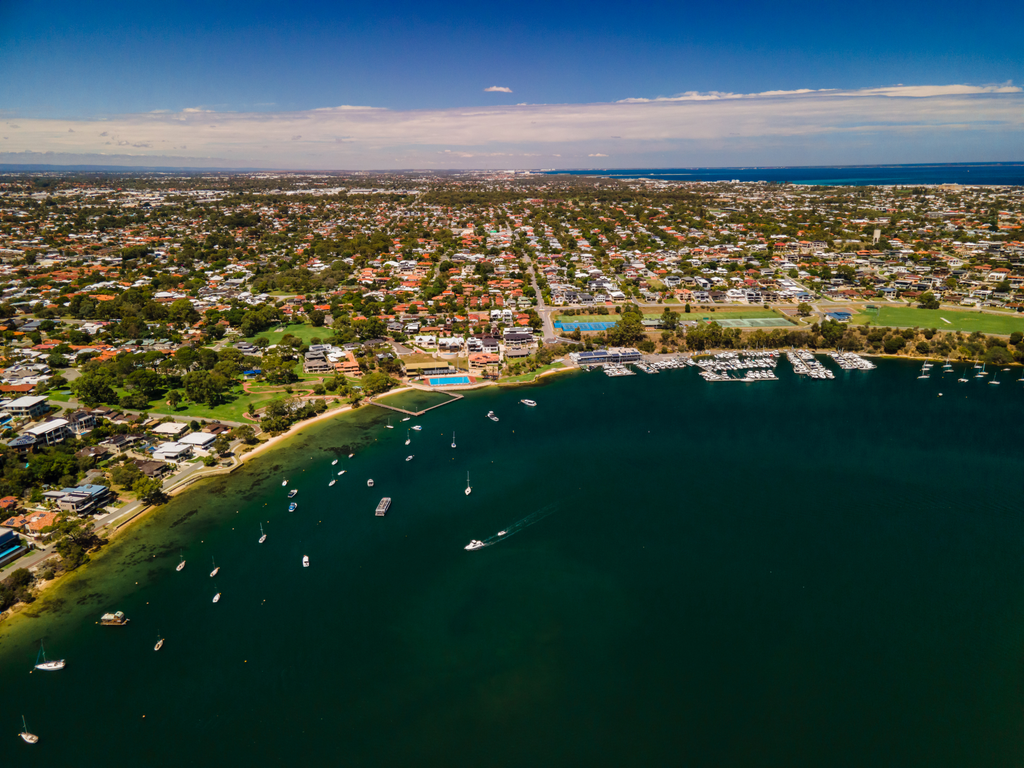
Ms Ezzy added that under the old caps, first home buyers in Perth had access to just two suburbs with a median house value under the $600,000 limit, Medina ($590,786) and Mandurah ($589,965). Choices in Brisbane and Adelaide were also largely limited to units, with only 36.9% and 41.3% of suburbs respectively falling under the old caps.
“Since the caps were last revised in 2022, values across the mid-sized capitals have grown significantly, which has seen first home buyers reliant on the scheme to purchase a house, essentially priced out.”
For example, across Sydney and the Illawarra and Newcastle and Lake Macquarie regions, the cap has increased by $600,000 to $1.5 million. In Southeast Queensland and Adelaide, the caps have both increased by $300,000 to $1 million and $900,000 respectively.
The expanded scheme provides a marked increase in options
- Nationally, just over half of house markets (51.6%) now fall under the new price caps, and 93.7% of unit markets.
- Adelaide saw the largest increase for houses, with 46.6% of suburbs (130) now qualifying, up from just 2.9% (8) previously.
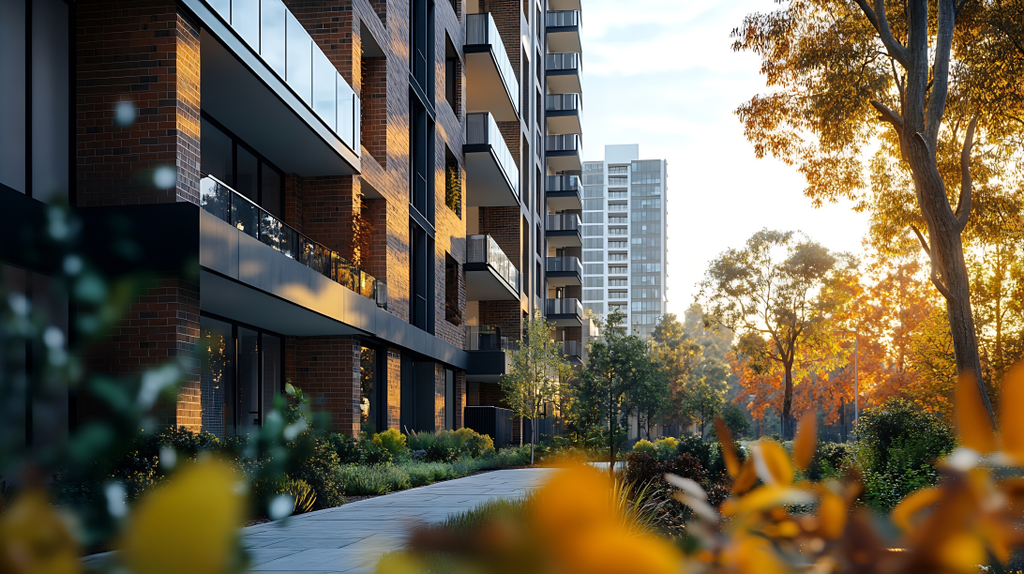
- Brisbane saw the largest proportional increase for units, with 97.5% of suburbs (153) now qualifying, up from just 36.9% (58).
“While this is a demand-side policy that will undoubtedly put some upward pressure on values, it will help create a more equitable starting point and provide more options for those looking to get on the property ladder,” Ms Ezzy said.
Other highlights from the September Housing Chart Pack include:
- Cotality estimates the combined value of residential real estate rose to $11.7 trillion at the end of August.
- Momentum in national housing values has continued to build with dwelling values up 1.8% over the three months to August, the largest quarterly increase since Q2 2024 (2.0%).
- The annual growth trend also shifted higher for the second consecutive month, ramping up from a low of 3.6% over the 24/25 financial year to a 4.1% rise over the 12 months to August.
- Growth in the most affordable 25% of combined capital city homes (2.1%) was outpaced by the middle 50% of market (2.2%) in the three months to August. This is significant because the bottom quartile has led market growth for almost two years.
- The mid-sized capitals are once again driving growth, with values in Brisbane and Perth up 1.2% and 1.1% respectively in August. Darwin continues to lead the capitals for quarterly and annual growth, however, up 5.0% over the three months to August and 10.2% over the past 12 months.
- Cotality estimates 43,436 sales occurred nationally in August, taking the rolling 12-month count to 538,329 — 2.0% higher than this time last year and 3.8% above the previous five-year average.
- While down -10.3% from the level seen this time last year, and -1.3% shy of the previous five-year average, listing activity rose 9.4% in August, with easing interest rates, rising sentiment and stronger capital gain conditions setting the stage for a cracking spring selling season.
- Both the combined capitals and regions have seen momentum build in rental trends. Since bottoming out in June, the 12-month change in capital city rents has lifted 70 basis points to 3.4%, while the change in regional rents shifted from 5.3% over the 24/25 Financial year, to 5.8% over the year to August.
- Monthly dwelling approvals dropped -8.2% in July, following the massive 12.2% rise in June. The month-on-month decline was led by the unit segment, with approvals down -18.8%, while house approvals inched slightly higher over the month, up 0.6%.
- The September ‘Chart of the Month’ shows the increased First Home First Home guarantee scheme price caps, set to be introduced on the 1st of October, and compares them with each region’s current median house and unit values. Under the expanded caps, first home buyers will have significantly more choice, with 63.1% of the 4,848 house and unit markets analysed nationally recording a median under the respective limits.
Download the full chart pack