


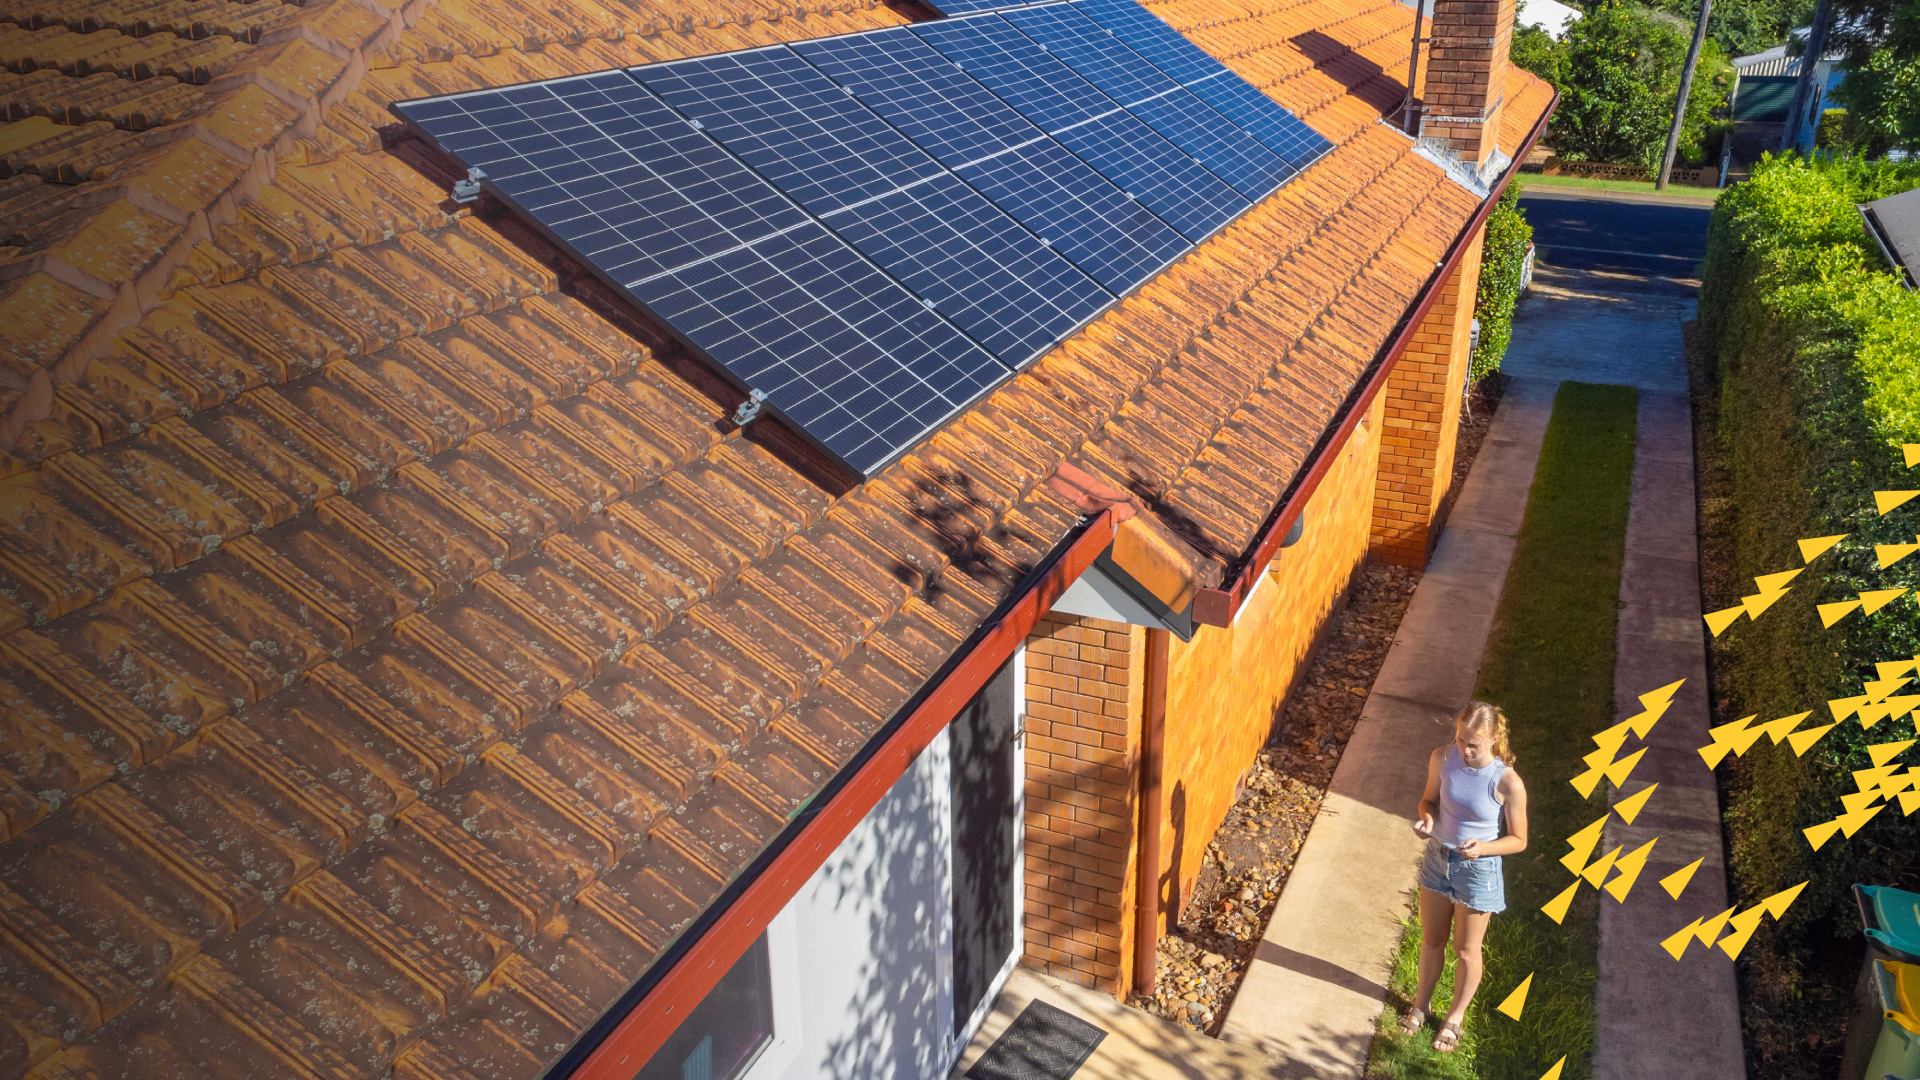
2.7%
The average value uplift for homes with solar power systems
1.3%
The average nationwide value premium achieved by having an additional NaTHERS estimated energy efficiency star
$21,350
The average uplift for an additional NaTHERS estimated energy efficiency star in Sydney

Introduction
.svg)
Foreword
Australia’s housing market is at an inflection point where energy performance, once peripheral to value, is increasingly becoming a consideration in how homes are compared, bought, managed, financed, insured, improved and regulated., This analysis was carried out using energy estimates generated based on Cotality property data combined with CSIRO’s RapidRateTM tool, aggregated solar information from Geoscape, and our AVM.
The report is supported by CommBank and was developed in collaboration with Cecille Weldon, Director Weldonco Advisory and Project Lead for the Proptech Energy Efficiency Features Standard backed by Proptech Australia. Together, we are working to build a more affordable, resilient and sustainable housing system, one where energy performance is visible, valued, and actionable.
The research arrives at a time of accelerating change. Energy costs remain elevated; energy efficiency disclosure requirements are tightening; and lending to support customers in realising energy bill savings and to aid the transition to a lower-carbon economy is becoming more mainstream. Against this backdrop, understanding the deepening link between residential energy efficiency and value is essential for more informed decision-making across the property ecosystem.
Cotality’s findings highlight that homes with energy and efficiency upgrades are delivering not only long-term energy bill savings and comfort, but also measurable price premiums at a time when cost-of-living concerns are top of mind for Australians. These signals are visible in transaction and valuation data, with implications for homeowners, buyers, investors, lenders, policymakers, and developers alike.
These insights also provide an evidence base for evolving energy efficiency disclosure frameworks, targeted property upgrade incentives, and climate-aligned design and development strategies. As energy performance becomes more attractive for buyers, the ability to respond with data-driven tools and forward-looking policy will shape how the housing sector adapts.
This work also reflects CommBank’s broader commitment to supporting Australia’s transition to net zero, helping customers better understand their climate impact and make informed choices as a part of the move to a lower-carbon economy.
Collaboration is also helping bring together the best available science, property data, and financial insights, which provides the ability to quantify emerging market dynamics at scale and help all industry stakeholders and consumers to respond with clarity and confidence.
We are proud to share these findings and believe they provide an invaluable foundation for smarter, more sustainable decisions, today and into the future.
Tom Coad
Senior Director, Banking and Finance
Cotality Australia
September 2025

Introduction
Quantifying the shift in Australian housing
Australia’s housing market is being reshaped by a merging of environmental, financial, and regulatory forces. While the built environment has long been a focus of national climate goals, the role of energy efficiency in influencing property value has remained largely anecdotal until now.
Watt’s it Worth examines the relationship between residential energy performance and market value, with a specific focus on solar power systems and estimated thermal energy efficiency. It quantifies the estimated price premium associated with these features and explores the wider implications for buyers, investors, lenders, policymakers, and developers. In doing so, it helps fill a longstanding gap in the market and a lack of consistent, evidence-based insight into whether and how sustainability is priced into housing.
These findings are being delivered at a crucial time.

As energy costs fluctuate and household budgets are under pressure, consumer preferences are shifting. Buyers are increasingly drawn to homes that offer more than aesthetic appeal or location advantage, such as improved comfort, lower running costs, and resilience to rising electricity and gas prices. These expectations are now improving with a more suitable supply network too, as new builds adopt more efficient standards and solar uptake continues to accelerate across existing housing stock, partly driven by the increasing standards in the National Construction Code (NCC).
Responding to these key market shifts, the property technology sector, which underpins all aspects of the property experience for the real estate sector and consumers, has recently launched the Proptech Energy Efficiency Features Standard for residential property. This Australian-first industry-led, data standard for energy efficiency features in residential property will enable clarity and visibility for these features at key decision-making moments in the property journey. It sends a strong signal that energy efficiency features and energy ratings are key to the next generation of property experiences and insights.
From a policy and regulatory perspective, Australia is entering a period of increased transparency and disclosure. NatHERS expansion, Scope 3 emissions reporting, which refers to indirect emissions generated from a company’s value chain, such as from financed or insured properties, and sustainability-linked lending products, are all raising the profile of energy performance. However, for many stakeholders, clear, data-backed evidence of what this all means for the market has been missing.
Watt's it Worth is a defining report that answers questions and addresses the need for credible information. It demonstrates that energy performance and energy-efficient features are increasingly a measurable contributor to property value.

Part 1: The solar uplift
Rooftop solar power systems are one of the most visible and widely adopted home energy upgrades in Australian housing, and they show a measurable link to property value. Their relative affordability and ease of installation, as well as support through state and federal rebates, have likely contributed to their increasing uptake across a broad spectrum of housing markets.
Regression analysis across almost six million homes appears to demonstrate a consistent price premium associated with the presence of solar power systems. At the national level, houses with solar systems are valued at around 2.7% more than comparable dwellings without, equating to an uplift of approximately $23,100 when controlling for other attributes.
The impact, however, differs significantly by region:
- In regional Northern Territory, solar added an estimated 6.9% to the median house value, about $31,350 in dollar terms, reflecting high energy demand for cooling and heating as well as abundant sunlight.
- In Hobart, the uplift was 5.4%, the strongest among the capital cities.
- In Sydney, the percentage effect was smaller at 1.6%, yet the higher baseline values meant the estimated dollar premium still reached $19,179.
- By contrast, Perth recorded a larger percentage gain (2.1%) but a smaller dollar impact ($14,939).
When aggregated across Greater Capital City (GCC) areas, the modelled uplift ranged between $14,093 (Adelaide) and $30,459 (Hobart), shaped by variation in property values, dwelling types, and consumer preferences. Importantly, the uplift was evident across diverse market segments rather than being confined to higher-value suburbs or income brackets.
This aligns with broader findings from CSIRO and other market participants that home energy upgrades are becoming more visible and common in for sale listings, and that consumer search behaviour increasingly favours these inclusions, although at this time the way these features are represented is inconsistent.
The value uplift data suggests that buyers are more likely to respond to home energy upgrades if they can deliver immediate and ongoing cost-of-living benefits. Solar reduces reliance on grid electricity, helps manage energy bills, and, for some households, improves energy resilience.
Beyond formal value indicators, there is a key shift in “perceptions of value” at the point of sale or rent. When upskilled on home energy upgrades and well-versed in the larger market drivers, the real estate sector is in a prime position to deliver more comprehensive property services and a more meaningful customer experience – and at a time when most people coming to an open home have cost-of-living concerns.
Beyond the buyer perspective, lenders are likely to view the property-level verified energy efficiency data as increasingly relevant to ESG reporting and sustainability-focused products.
Policymakers can point to these market signals in shaping incentive schemes and disclosure requirements, while developers and asset managers may treat a solar power system as a baseline inclusion in new projects rather than a discretionary add-on.
Currently, a solar power system is one of the few home energy upgrades that is both easily recognised by buyers and reliably measurable in valuation models and warrantied for a long period of time. This combination explains why its benefits are being priced into the market today as a key energy feature and as a material factor in how homes are valued, financed, and transacted.
Part 2: The efficiency premium
Energy efficiency features and energy ratings have historically been absent from traditional valuation models, primarily because these key features were largely missing from the whole property experience and the systems and processes that identify and record key property features at time of sale or rent.
This fragmentation and lack of standardisation has been a key barrier to measuring the impact of these features at scale. While features like insulation, glazing and orientation are known to improve thermal comfort and reduce energy bills, there has been limited data on how, or whether, those attributes influence market pricing.
Using Cotality’s Energy Efficiency Portfolio Analytics in combination with our valuation model, the analysis examined how estimated NatHERS star ratings (from 1-10) correlate with property value. The results appear to show a consistent relationship.
Across the national sample, an additional star was linked to a median uplift of 1.3% in estimated home value, or around $10,560. The effect varied by location:
- Sydney’s uplift translated to about $21,000 for an additional star.
- Regional South Australia has a premium of 2.7%, highlighting the importance of efficient design in more climate-exposed markets.
- Darwin had the highest observed uplift at 4.5% for an additional star, reflecting the value of improved performance in managing climatic extremes.
- Brisbane recorded the smallest uplift at 0.4%, equivalent in dollar terms to approximately $3,700 for an additional star, suggesting the sub-tropical climate may reduce perceived value from efficiency upgrades.
What makes these findings significant is not only the value uplift itself, but the fact that energy performance can now be measured consistently at scale.
To date, the ACT has led the country as the only jurisdiction with mandatory disclosure for energy ratings for more than two decades now.
However, the current absence of transparency on a national level has limited consumer understanding of residential energy efficiency and the benefits it can deliver and weakened an understanding of price impact within the broader market.
All jurisdictions are now working together to develop the formal requirement for a Home Energy Rating assessment at the point of sale, requiring disclosure of the rating in property marketing.
With more than 70% of Australia’s housing stock, excluding apartments, sitting below four stars out of 10, these underperforming homes, uncomfortably hot or cold with high running costs, represent both an upgrade opportunity and a growing source of exposure for owners, investors, and insurers.
Improving a property with energy efficiency features is increasingly linked to capital growth and protection from rising energy and retrofit costs. Buyers are paying closer attention to inclusions that deliver the potential for a more comfortable home all year round, lower operating costs, and the likelihood of future energy upgrades, especially in older properties that fall below current NCC standards.
The introduction of Energy Ratings into the residential data landscape and the standardisation of energy efficiency features across the property sector will deliver much needed transparency and a more comprehensive view of property, and will impact how homes are appraised, viewed, assessed, compared, priced and marketed. These considerations have already begun to shift our perceptions of value, influencing our expectations of a better home.
For developers and builders, the findings reinforce the commercial case for delivering higher-performing stock and ensuring these features are showcased at point of sale or rent. In growth corridors and newer precincts, for example, energy ratings are becoming a point of differentiation rather than a compliance exercise.
These signals are still emerging, but the ability to quantify them at scale marks a turning point. With consistent, property-level benchmarks now available, the relationship between energy efficiency and value is becoming transparent and actionable.
Deep dive: Mapping Australia's solar uptake
Solar coverage for Australian houses shows a remarkable level of diversity across the broad regions and climate patterns of the country, ranging from more than 40% of houses across Perth, Adelaide and Brisbane to less than 20% of houses in Hobart, Regional Victoria and Regional Tasmania. Nationally, 29% of houses have solar.
How do we know?
The penetration of solar power systems, sourced from Geoscape, is dependent on a broad range of factors, including environmental (how much solar radiation and climatic conditions), policy (what state-level incentives are available), housing (stand-alone homes are more likely to have solar) and economic factors (electricity prices, upfront costs).
In fact, about 7% of Australian suburbs have at least half of the detached housing stock with rooftop solar, topped by the Sydney suburb of Bungarribee where 96% of homes have solar.
Most of the suburbs with a high coverage of domestic rooftop solar are in relatively new housing estates or rural residential markets where detached housing is the predominant form of housing, roof spaces tend to be larger and there is less blockage from shade. In the case of new housing estates, it is becoming more common for builders to include rooftop solar panels as part of the building package.
Conclusion
Implications for the housing market and financial sector
This report confirms a clear trend: homes with solar power systems and higher energy ratings are attracting strong buyer interest and demonstratable price premiums. These signals are showing up in search behaviour and valuations.To unlock the full value of energy performance, consistent data capture is key. Standardising how key property features such as solar power systems and energy ratings are recorded—across listings, contracts, and valuations—builds the foundation for smarter investment, policy, and product design.
Better data also powers lending opportunities. With energy metrics now measurable at scale, lenders can have a better understanding of property performance, which may help with offering products for efficient homes. Renovation incentives, council discounts, and insurer benefits further align financial outcomes with performance.
For buyers, sellers, and developers, the message is clear: energy upgrades boost comfort, cut bills, and protect long-term value. Lenders and developers are already adapting, and international models show what’s possible when energy ratings are embedded in housing systems.
Australia has a chance to lead. The ACT’s long-standing disclosure rules prove that trusted ratings influence buyer behaviour and pricing. The opportunity now is to make energy performance a core part of how we build, buy, showcase, market, improve and value homes.
Methodology
This analysis quantifies the relationship between residential energy performance and property value using a regression-based statistical approach. It isolates how specific features, namely estimated NatHERS Star Ratings and the presence of a solar power system, contribute to a property's market value, independent of other factors.
Two bespoke versions of Cotality's Hedonic Model, which also underpins our national Home Value Index (HVI), were used to run the analysis. This model estimates the marginal effect of individual property characteristics by controlling for location, land size, dwelling type, floor area, and other known value attributes. In this instance, we extended the model to include two additional variables:
- An estimated NatHERS-aligned star rating for energy efficiency (produced via Cotality's Energy Efficiency Portfolio Analytics platform), and
- A variable indicating whether the property had a solar power system installed, based on Geoscape National Solar data.
All property attributes and valuation data were drawn from the 12 months to 15 April 2025. This effective date aligns with the version of the Portfolio Analytics model used, ensuring a consistent reference point across energy, sales, and valuation data.
The models estimate the average percentage change in AVM (Automated Valuation Model) value associated with:
- A one-star increase in estimated energy rating; and
- The presence of a solar power system versus no solar power system, with all other attributes held constant.
To help interpret these results at a local level, we translated the modelled percentage changes into an estimated dollar impact for each Statistical Area Level 3 (SA3). This was calculated by applying the percentage change to the median AVM in each area. For example, a one-star increase associated with a 1.5% uplift on a median AVM of $800,000 equates to an estimated $12,000 increase in value. Multi-star increases were not modelled.
This methodology is designed to reveal how energy features correlate with property value across the broader market. It is not intended to predict the value of an individual home or replace a professional valuation. Rather, it helps identify where energy efficiency is being priced in, and by how much, based on robust, data-driven modelling.
As with all statistical models, findings are subject to the accuracy of input data and the limitations of the model's assumptions. Cotality measures the input quality for the energy efficiency estimates, which it aggregates at an average of 0.47. Observed features increase this, whereas modelled and inferred features decrease this. Assumptions are made on non-visible features like insulation.
Note that while solar power system batteries may be present at the properties, they have not been factored in as an attribute.
However, this approach enables a consistent, scalable view of emerging price signals across Australia's residential property landscape.
Acknowledgement
Our partners
Geoscape Australia

Geoscape Australia is delivering location intelligence to enable positive outcomes across the economy, to help build a smarter, safer and more productive Australia.
Geoscape Australia is the trading name of PSMA Australia Limited, a self-funded public company owned by the 9 governments of Australia.
About National Solar
National Solar was used in the creation of this report - a national dataset that spatially represents photovoltaic solar panel-related features and provides aggregated solar information at the address and building.
National Solar is populated from two different capture sources and the population of the product schema will vary between these as follows:
- Urban (satellite source) - areas with a population greater than 200, or with significant industrial/commercial activity in a visual assessment, digitised from satellite imagery.
- Urban (aerial source) - areas with a population greater than 200, or with significant industrial/commercial activity in a visual assessment, digitised from aerial imagery.
Key Features of National Solar
- Maps each solar array with type, size and daily output
- Totals solar capacity per address and building, linked to G‑NAF and Geoscape Buildings
- Simple yes/no flag for solar at each location
- Extra roof details: material, slope, shape and planning zone
Disclaimers
CommBank disclaimers
This article is intended to provide general information of an educational nature only. It does not have regard to the financial situation or needs of any reader and must not be relied upon as financial product advice. You should consider seeking independent financial advice before making any decision based on this information.
While CommBank supports Australia's transition to net zero by 2050, the views expressed in this report do not necessarily reflect the views of CommBank.
Cotality disclaimers
RapidRate used to calculate the star rating and outputs is not accredited software under the Nationwide House Energy Rating Scheme (NatHERS) and any star rating or other outputs generated represents an estimated NatHERS star rating and is not a replacement for a NatHERS Certificate.
While the software has been created with due care, the information used to train the software will continue to develop over time, and there is no warranty or representation that the star rating or other outputs are free from errors or omissions or generated with appropriate or accurate assumptions.
The star rating and other outputs are estimated based on certain inputs and assumptions, and no claim is made as to the accuracy, completeness, reliability, currency, suitability or otherwise of the star rating or other outputs, especially where Cotality Input Data is based on assumptions.
The star rating and other outputs are provided on the basis that the Customer or End User receiving the star rating and other outputs are responsible for assessing whether it will meet its requirements and be fit or suitable for that person’s or organisation’s purpose or intended use.
