Overview
- The pace of annual rental growth across Australia’s capital cities has picked up for the first time in more than two years, sparking concerns over renewed pressure on housing inflation, according to Cotality’s August Monthly Housing Chart Pack.
- The capital city rental value index rose 3.0% in the year to July, up from 2.7% in June, marking the end of a 16-month run of moderating or stable rental growth.

The pace of annual rental growth across Australia’s capital cities has picked up for the first time in more than two years, sparking concerns over renewed pressure on housing inflation, according to Cotality’s August Monthly Housing Chart Pack.
Cotality’s capital city rental value index rose 3.0% in the year to July, up from 2.7% in June, marking the end of a 16-month run of moderating or stable rental growth.
Cotality Economist Kaytlin Ezzy said the trend bears watching, given the significant weighting rents have in the consumer price index (CPI) basket.
“The housing component makes up more than one-fifth of the CPI basket, with rents alone accounting for 6.6%,” Ms Ezzy said.
The latest quarterly CPI data from the ABS showed that rents-paid rose 4.5% over the year to June, down from the 7.8% rise seen over the year to March 2024.
“While this easing of growth reflects an overall moderation in rental demand — amid normalising net overseas migration and an uptick in average household size — the ABS noted that the annual growth in rents-paid would have been higher had it not been for changes in Commonwealth Rent Assistance reducing the amount payable for eligible tenants.”
Annual change in rents - Cotality capital city rental index v CPI rents-paid
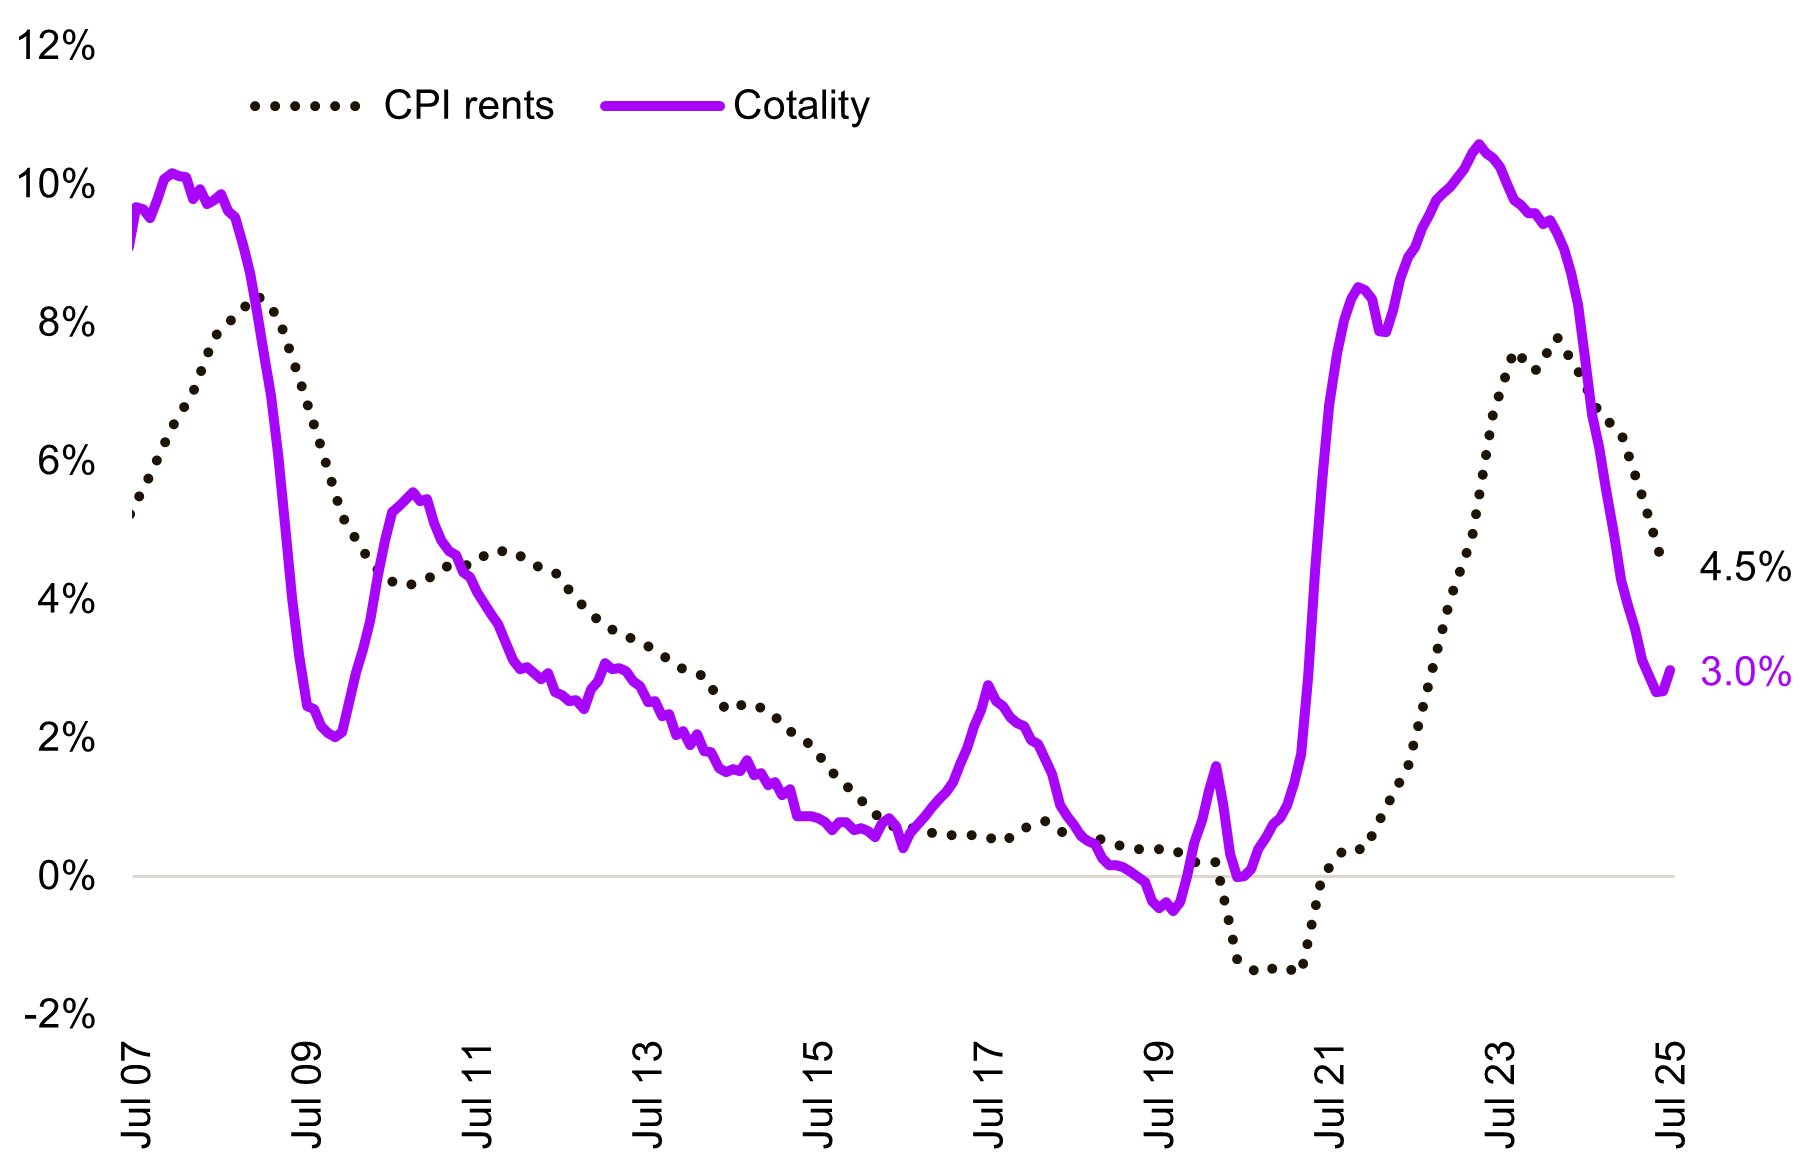
Source: ABS, Cotality
“Given the strong, albeit lagged, correlation between the CPI’s rents-paid and changes in the Cotality rental value index, the recent uplift is a trend to watch,” continued Ms Ezzy.
Adding to the concern for housing inflation is the mild uptick in construction costs, with the annual change in the Cordell Construction Cost Index rising 2.9% over the year to June, up from 2.6% over the 12 months to June 2024.
“While still well below the pre-covid decade average of 4.0%, this re-acceleration mirrors the recent quarterly increases in the ‘new dwellings’ component of the CPI basket — the only subcomponent with a larger weighting than rents (7.6%).”
“With both rents and construction costs indicators trending higher, we could see housing inflation rise in the coming months, which, if it feeds back into the inflation outlook, could lower the chance of future rate cuts,” concluded Ms Ezzy.
Sydney and Brisbane lead rental growth re-acceleration
Looking across the individual capitals, Sydney and Brisbane led the re-acceleration in capital city rental growth. In Sydney, the annual change in dwelling rents has risen from a recent low of 1.8% over the year to May, to 2.4% over the 12 months to July, while Brisbane’s 12-month rental trend has risen 1.4 percentage points from February lows of 3.2% to 4.6%.
“In particular, these cities' unit markets have driven this uptick, with the pace of rental growth in Brisbane and Sydney’s medium and high-density sectors up 2.3 and 1.1 percentage points respectively from recent lows.”
Ms Ezzy said these shifts highlight underlying rental market tightness with vacancy rates holding near historic lows across these capital’s unit sectors.
When looking at the re-accelerations in annual rental growth across capital city sub-regions (SA3s), Brisbane and Sydney again dominated, with each city claiming five and four spots on the top ten list, respectively.
Carindale in Brisbane was the largest uptick, up 3.1 percentage points, with the annual trend rising from 1.3% in June to 4.5% in July. Botany in Sydney followed, with the 3.0 percentage point uptick taking the annual trend from -1.1% over the year to June, to a 1.9% increase over the 12 months to July.
Bayside in Melbourne’s Inner-South was the only sub-region outside of Sydney and Melbourne to make the top ten list, with annual rental growth rising 1.9 percentage points over the month to 2.8%.
“Despite the strong uptick in some regions, Melbourne, as a whole, is yet to see an uptick in the pace of rental growth, with annual increases holding steady at 1.1% over the year to July. “
Listings shortages continue to tilt market conditions towards sellers
Listings remain scarce across the country, with just 121,113 properties observed for sale nationally over the four weeks to August 3rd, almost 20% below the average for this time of year. This shortfall in listings has been felt across the country, with every capital and rest-of-state region recording fewer new and total listings compared to this time last year.
“This persistent shortage of stock is seeing buyers faced with increasingly limited options, skewing selling conditions back in favour of vendors,” Ms Ezzy said.
Ms Ezzy added that the skew towards sellers can be seen in median vendor discounting and auction clearance rates, with sellers now offering smaller discounts in order to secure a sale, and the capital city clearance rate reaching a 17-month high at 69.4% over the week ending 20th July.
“With demand expected to be further buoyed by the August rate cut, and conditions skewed towards buyers, we should be in for a strong spring selling season once the flow of new listings normalises.”
Other highlights from the August Housing Chart Pack include:
- Cotality estimates the combined value of residential real estate rose to $11.6 trillion at the end of July.
- National housing values rose 1.8% over the three months to July, the highest quarterly increase seen since this time last year.
- After easing for 16 consecutive months, the annual rate of growth in national home values ticked higher in July, with values up 3.7% over the year to July, up from the 3.5% lift seen over the 12 months to June.
- The gap between the median capital city house and unit value reached a new record high in July, with houses demanding a 48.0% premium, equivalent to approximately $338,965. Sydney shows a remarkable 75.7% difference between the median house and unit value.
- Across the capital cities, Darwin continued to lead the pace of quarterly growth, with dwelling values up 5.6% over the three months to July, followed by Perth and Brisbane, with values increasing 2.6% and 2.3% respectively.
- Cotality estimates 42,801 sales occurred nationally in July, taking the rolling 12-month count to 526,747, roughly in line with the levels seen this time last year (0.4%) and 1.9% above the previous five-year average.
- The national median time on market rose to 35 days over the three months to July after briefly dipping to 30 days over the three months to April.
- Across the capitals, Darwin has seen the steepest pullback in median vendor discounting, from 4.1% in Q4 24 to 3.3% over the three months to July. Vendors in Melbourne (3.2%), Sydney (3.2%), and Perth (2.9%) are also offering smaller discounts compared to the three months to December 2024, while Hobart (4.7%), Canberra (3.6%), and Adelaide (3.6%) have seen discounting rates expand.
- Over the four weeks to 3 August 2025, 68.3% of capital city auctions on average were successful. Sydney had the highest four-week average clearance rate at 69.6%, followed by Melbourne (67.9%), while Canberra had the lowest at 65.1%.
- Gross rental yields have seen a mild decline over the quarter, with national yields falling three basis points, from 3.71% in April to 3.68% in July.
- The August ‘Chart of the Month’ shows the recent uptick in the combined capitals annual rental trend and compares it to the annual change in CPI rents paid.