


Press Release
Cotality: Mortgage delinquencies remain steady across the U.S.


- The overall U.S. delinquency rate dropped to the lowest level since August 2024.
- The U.S.’s serious delinquency rate increased year-over-year.
- The U.S. foreclosure rate did not change in March 2025 compared to March 2024.
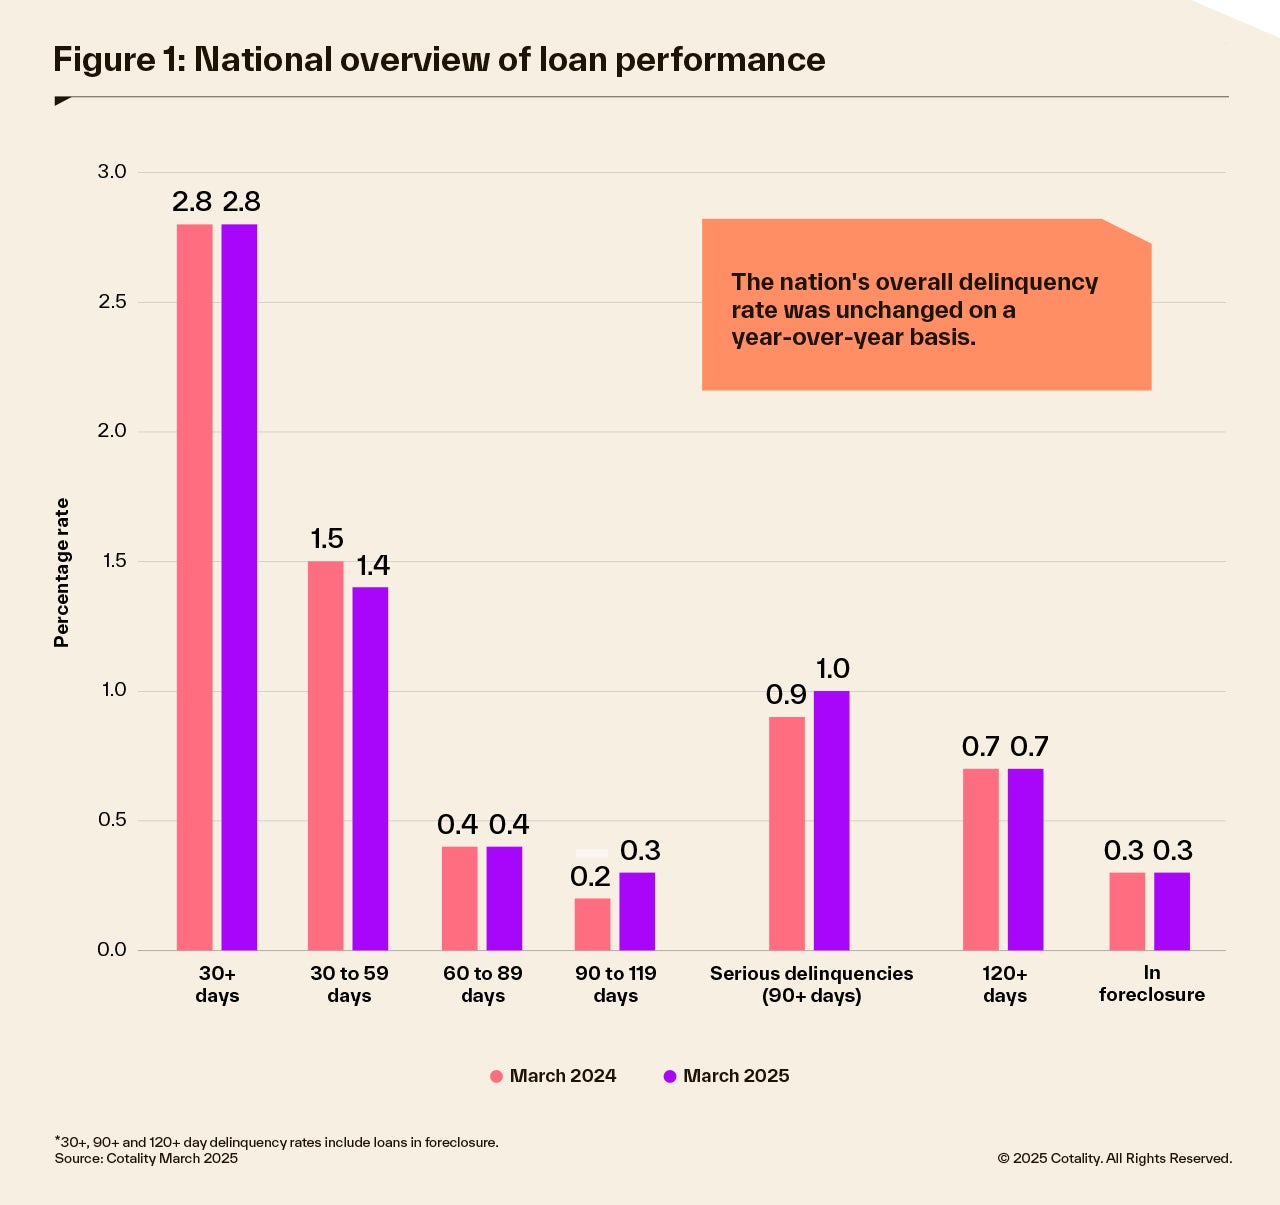
IRVINE, Calif., May 29, 2025 – Cotality, a leading global property information, analytics, and data-enabled solutions provider, today released its latest Loan Performance Indicators, which analyzes mortgage delinquencies nationally and across major metropolitan areas. In March 2025, the number of mortgages in some kind of delinquency (30 or more days past due, including foreclosures) remained at 2.8%, showing no year-over-year change.
“Mortgage delinquency rates held steady at a low level in the first quarter of 2025. Roughly 40% of metropolitan areas showed increases in the overall delinquency rate, comparable to the share from the fourth quarter of 2024,” said Molly Boesel, senior principal economist at Cotality. “Those areas posting the largest increases in delinquency rates in early 2025 also experienced natural disasters in 2024, and delinquency rates typically stay elevated in areas with natural disasters for about nine to 12 months. We can expect mortgage delinquency rates to stay low in 2025 and follow movements in the job market.”
Cotality examines all delinquency stages to gain a complete view of the mortgage market and loan performance health. In March 2025, the U.S. delinquency and transition rates and their year-over-year changes were as follows:
- Early-Stage Delinquencies (30 to 59 days past due): 1.4%, down from 1.5% in March 2024.
- Adverse Delinquency (60 to 89 days past due): 0.4%, unchanged from March 2024.
- Serious Delinquency (90 days or more past due, including loans in foreclosure): 1%, an increase from 0.9% in March 2024. The March 2025 serious delinquency rate of 1% continues its downward trend from a high of 4.3% in August 2020.
- Transition Rate (the share of mortgages that transitioned from current to 30 days past due): 0.6%, down from 0.7% in March 2024.
State and Metro Takeaways
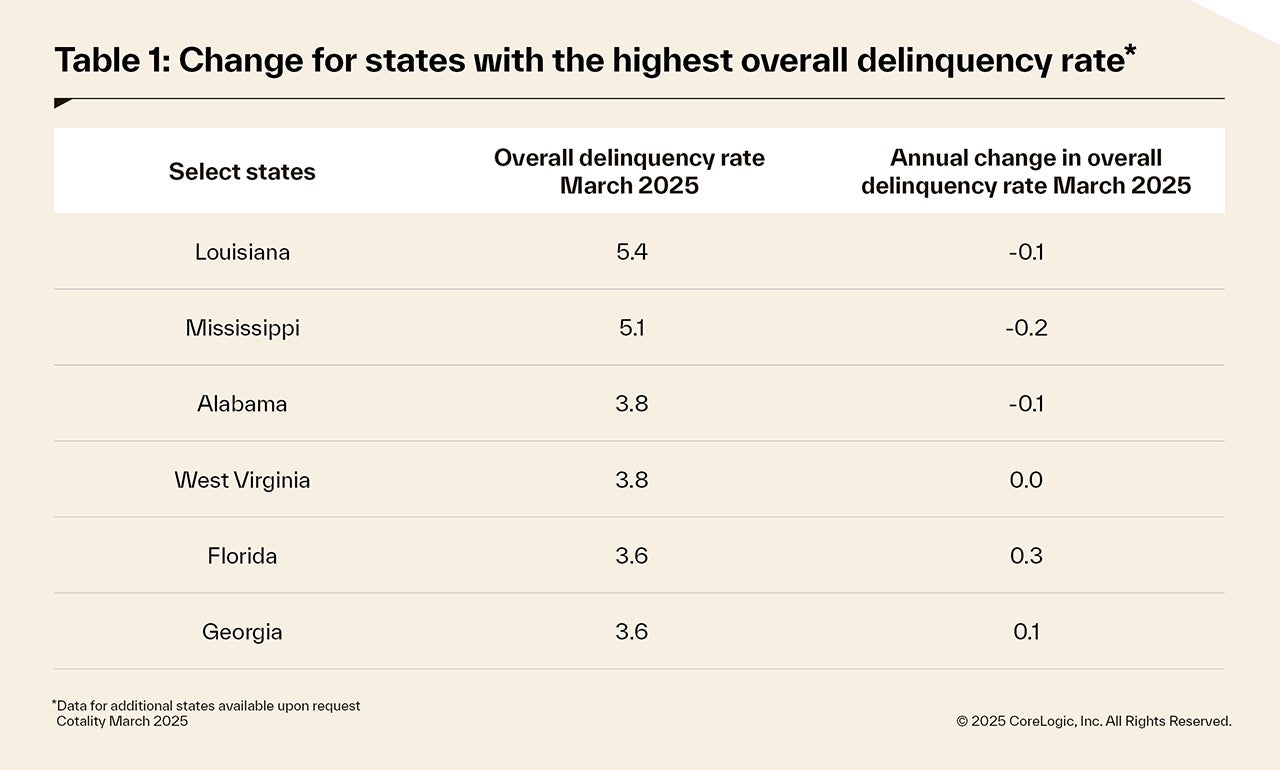
In March 2025, the District of Columbia and 15 states logged year-over-year increases in their overall delinquency rate. The states with the highest increases were: District of Columbia (up 0.7 percentage points); Florida (up 0.3 percentage points); and Nebraska (up 0.3 percentage points). All other states had changes ranging between -0.4 and 0.2 percentage points.
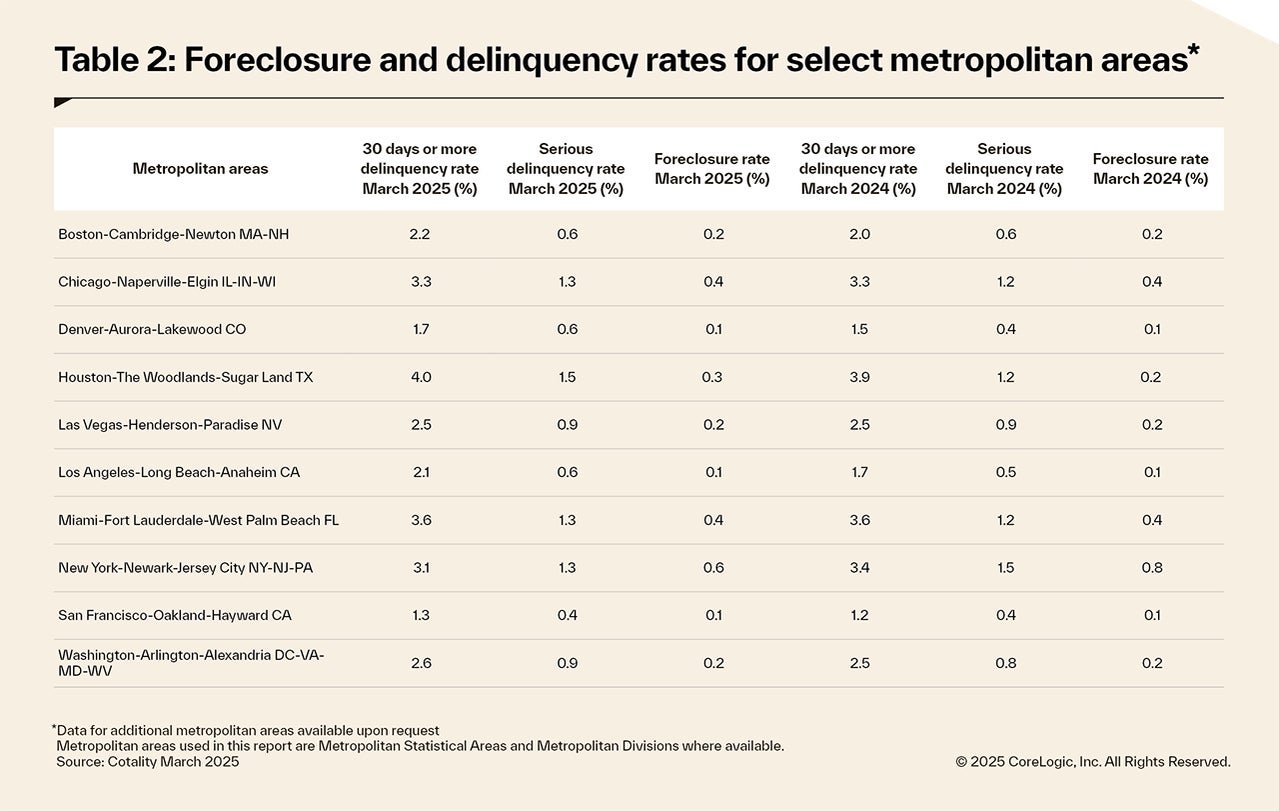
In March 2025, 154 out of 384 U.S. metropolitan areas posted an annual increase in their overall delinquency rate. The top areas include: Asheville, NC (up 1.0 percentage points), Tampa, FL (up 0.9 percentage points), Cape Coral-Fort Myers, FL (up 0.8 percentage points), and Lakeland-Winter Haven, FL (up 0.8 percentage points). All other year-over-year changes ranged between -1.2 and 0.7 percentage points.
In March 2025, 224 metropolitan areas posted an annual increase in their serious delinquency rate. The top areas include: Asheville, NC (up 1.0 percentage points); Tampa, FL (up 1.0 percentage point); Lakeland-Winter Haven, FL (up 1.0 percentage points); and Valdosta, GA (up 1.0 percentage points). All other year-over-year changes ranged between -1.1 and 0.8 percentage points.
The next Cotality Loan Performance Insights Report will be released on August 28, 2025, featuring data for the second quarter of 2025. For ongoing housing trends and data, visit the Cotality Insights Blog.
###
Methodology
The data in the Cotality LPI report represents foreclosures and delinquency activity reported through March 2025. The data in this report accounts only for first liens against a property and does not include secondary liens. The delinquency, transition, and foreclosure rates are measured only against homes that have outstanding mortgages. Homes without mortgage “liens” are not subject to foreclosure and are, therefore, excluded from the analysis. Cotality has approximately 75% coverage of U.S. foreclosure data. This data is compiled from public records, contributory databases, and proprietary analytics, and its accuracy is dependent upon these sources.
Source: Cotality
The data provided is for use only by the primary recipient or the primary recipient’s publication or broadcast. This data may not be resold, republished, or licensed to any other source, including publications and sources owned by the primary recipient’s parent company, without prior written permission from Cotality. Any Cotality data used for publication or broadcast, in whole or in part, must be sourced as coming from Cotality, a data and analytics company. For use with broadcast or web content, the citation must directly accompany the first reference of the data. If the data is illustrated with maps, charts, graphs, or other visual elements, the Cotality logo must be included on screen or website. For questions, analysis, or interpretation of the data, contact newsmedia@corelogic.com. Data provided may not be modified without the prior written permission of Cotality. Do not use the data in any unlawful manner.
About Cotality
Cotality accelerates data, insights, and workflows across the property ecosystem to enable industry professionals to surpass their ambitions and impact society. With billions of real-time data signals across the life cycle of a property, we unearth hidden risks and transformative opportunities for agents, lenders, carriers, and innovators. Get to know us at www.cotality.com.
Media Contact
Charity Head
Cotality