
Press Release
•
June 12, 2025
Cotality: Annual Home Equity Declines $4.2K on Average as US Home Price Appreciation Slows


- The number of underwater homes increased by 17% year over year to 2.1%, which is still lower than the 3.6% total pre-pandemic.
- Total homeowner equity for borrowers with a mortgage totaled $17.3 trillion in the first quarter.
- The average U.S. homeowner lost approximately $4,200 in equity during the past year, but that still leaves the average borrower with about $302,000 in accumulated home equity.
- If home prices rose 5%,150,000 properties would regain their equity; however, if prices fell 5%, 251,000 would fall into negative equity.
IRVINE, Calif., June 12, 2025 — Cotality, a leading global property information, analytics and data-enabled solutions provider, today released the Homeowner Equity Report (HER) for the first quarter of 2025. The report shows that U.S. homeowners with mortgages (which account for roughly 62% of all properties) saw home equity increase by $115 billion since the first quarter of 2024, a gain of 0.7% year over year, bringing the total net borrower equity to over $17.3 trillion in the first quarter of 2025.
Negative equity has been rising on a quarterly basis since Q2 2024. Just compared to the first quarter 2024, the number of residential properties that fell into negative equity increased by 172,000 homes or 17%.
"Strong home price appreciation since the pandemic has ensured that U.S. homeowners with a mortgage saw a significant rise in their home equity, with annual gains averaging over $38,000 between 2020 and the end of 2022. At the peak of home price gains, annual equity increases surged to as much as $55,000. However, with price increases slowing considerably and appreciation remaining sluggish, home equity is unlikely to accumulate at the same pace as it did during the pandemic, or even pre-pandemic, when annual gains averaged about $11,000. In addition, recent declines also reflect that some homeowners are tapping into their equity to finance other activities,” said Cotality Chief Economist Dr. Selma Hepp.
“Geographical differences are important here as the national average is being pulled down by weakening markets in the South — particularly in Texas and Florida — that are masking strong equity growth in the Northeast. However, given the weakening of prices in the South and affordability concerns for existing homeowners due to rising insurance and taxes, as well as the prevalence of natural disasters in those areas which can wipe out home equity, there are many areas in the South where we are likely to see increases in negative equity going forward.”
While 1.2 million residential homeowners, or 2.1% of homeowners with a mortgage, are in negative equity, many other homeowners — particularly in the Northeast — are benefitting from the continued rise in home prices and the resulting boost in equity. Year over year, New York, N.Y. and Boston, Mass. saw average equity gains of $20,600 and $25,200, respectively.
However, on the national scale, homeowners lost an average of $4,200 in equity between Q1 2024 and Q1 2025. That's a significant loss when compared to the $4,300 they gained year over year in Q4 of 2023 to 2024, or the nearly $30,000 annual increase they saw in 2023 through Q1 2024.
States across the Northeast saw the most home equity growth. Prices in Rhode Island and New Jersey reached new highs in Q1, with these states claiming the top two spots for year-over-year equity gains, rising $36,500 and $35,700, respectively. A total of 27 states posted annual equity losses, the top three of which were: Hawaii (-$65.9K), Washington D.C. (-$29.6K), and Florida (-$26.3K).
The national aggregate value of negative equity was approximately $350 billion at the end of the first quarter of 2025. This is up quarter over quarter by approximately $10.7 billion, or 3%, from $340 billion in the fourth quarter of 2024 and up year over year by approximately $26.6 billion, or 8%, from $324 billion in the first quarter of 2024.
Despite the steady increase in the share of homeowners with a mortgage in negative equity, to 2.1%, this is only a slight increase from the 1.7% low in Q2 2024 and notably lower than 3.6% pre-pandemic. Negative equity peaked at 26% of mortgaged residential properties in the fourth quarter of 2009, based on the Cotality equity data analysis which began in the third quarter of 2009.
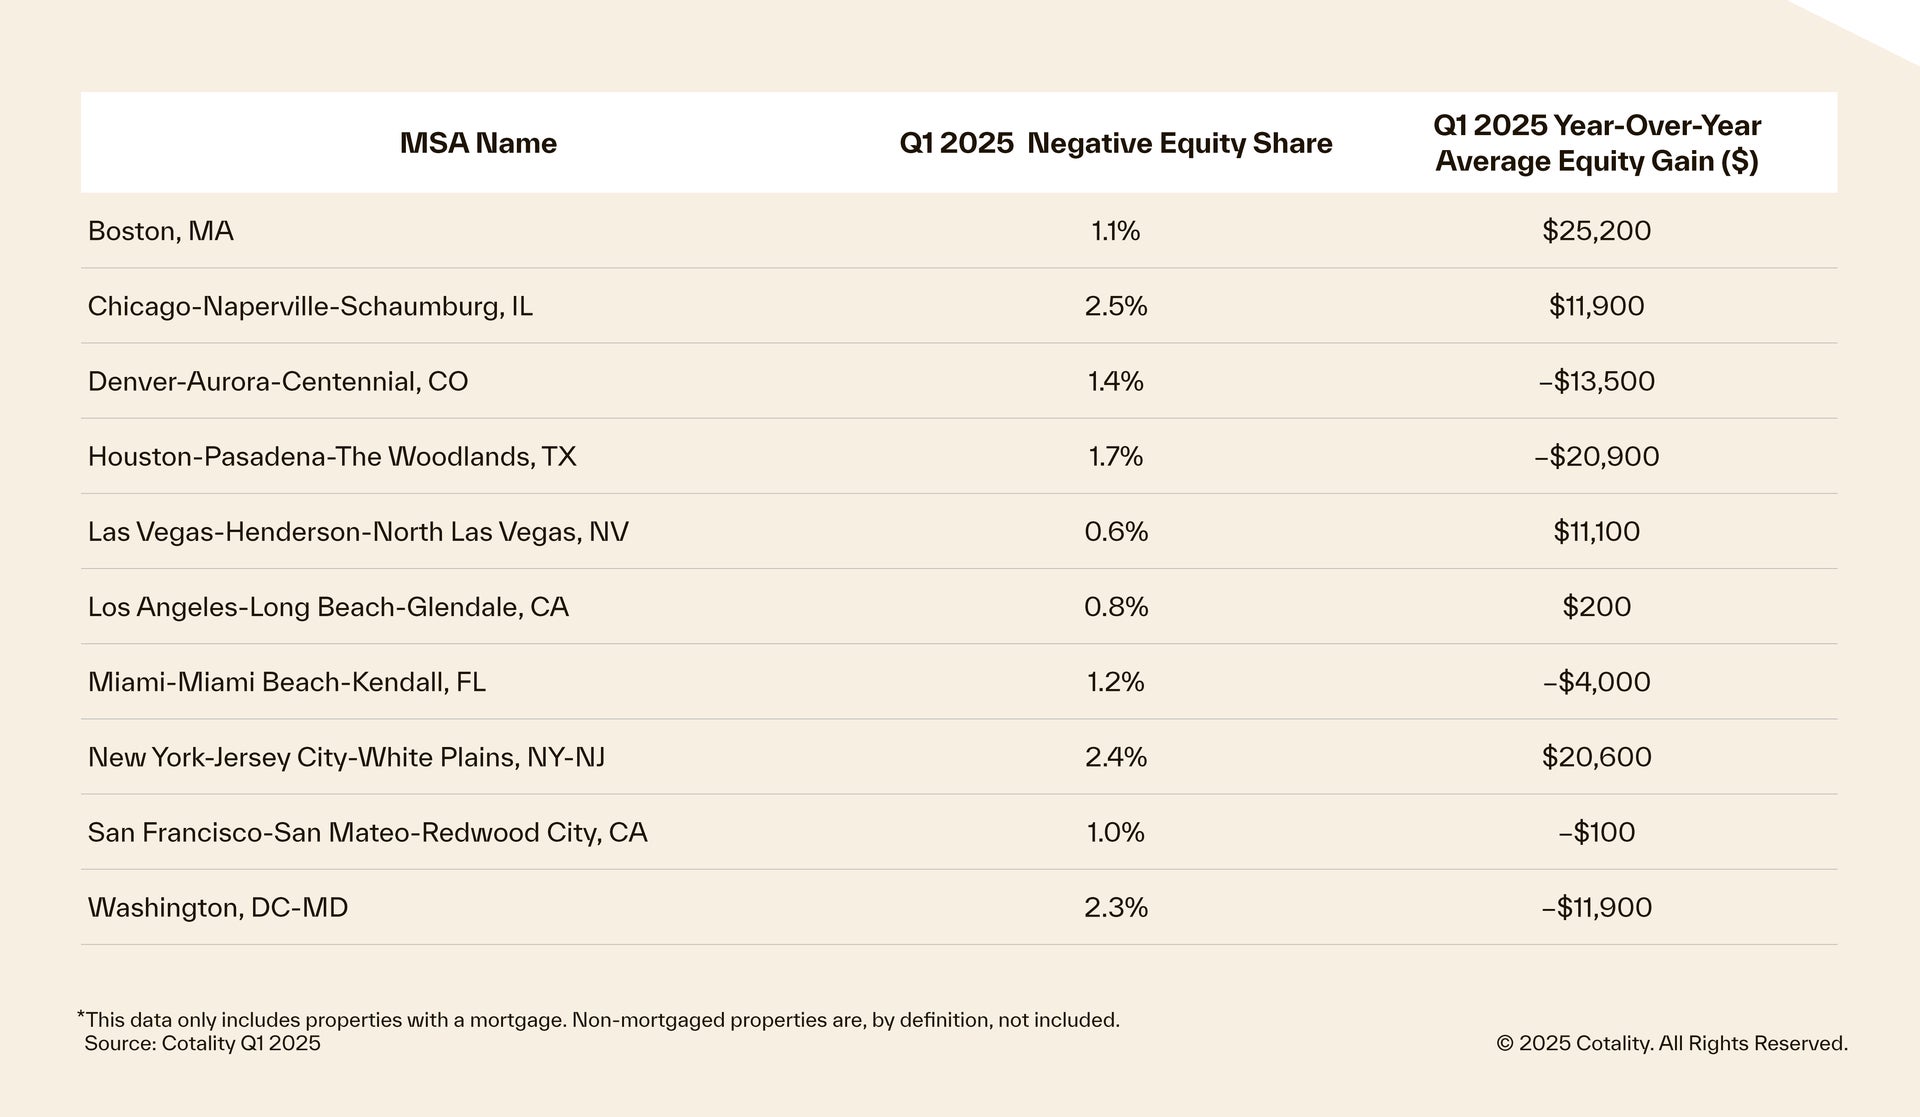
Cotality provides homeowner equity data at the metropolitan level. In Table 1, 10 of the largest cities, by housing stock, are depicted. While negative equity has seen an increase nationally, Los Angeles and San Francisco are the least challenged, with negative equity shares of all mortgages at 0.8% and 1.0%, respectively.
The next Cotality Homeowner Equity Report will be released September 11, 2025, featuring data for Q2 2025. For ongoing housing trends and data, visit the Cotality Insights Blog: www.cotality.com/insights.
###
Figure 1: Map of average year-over-year equity gain per borrower
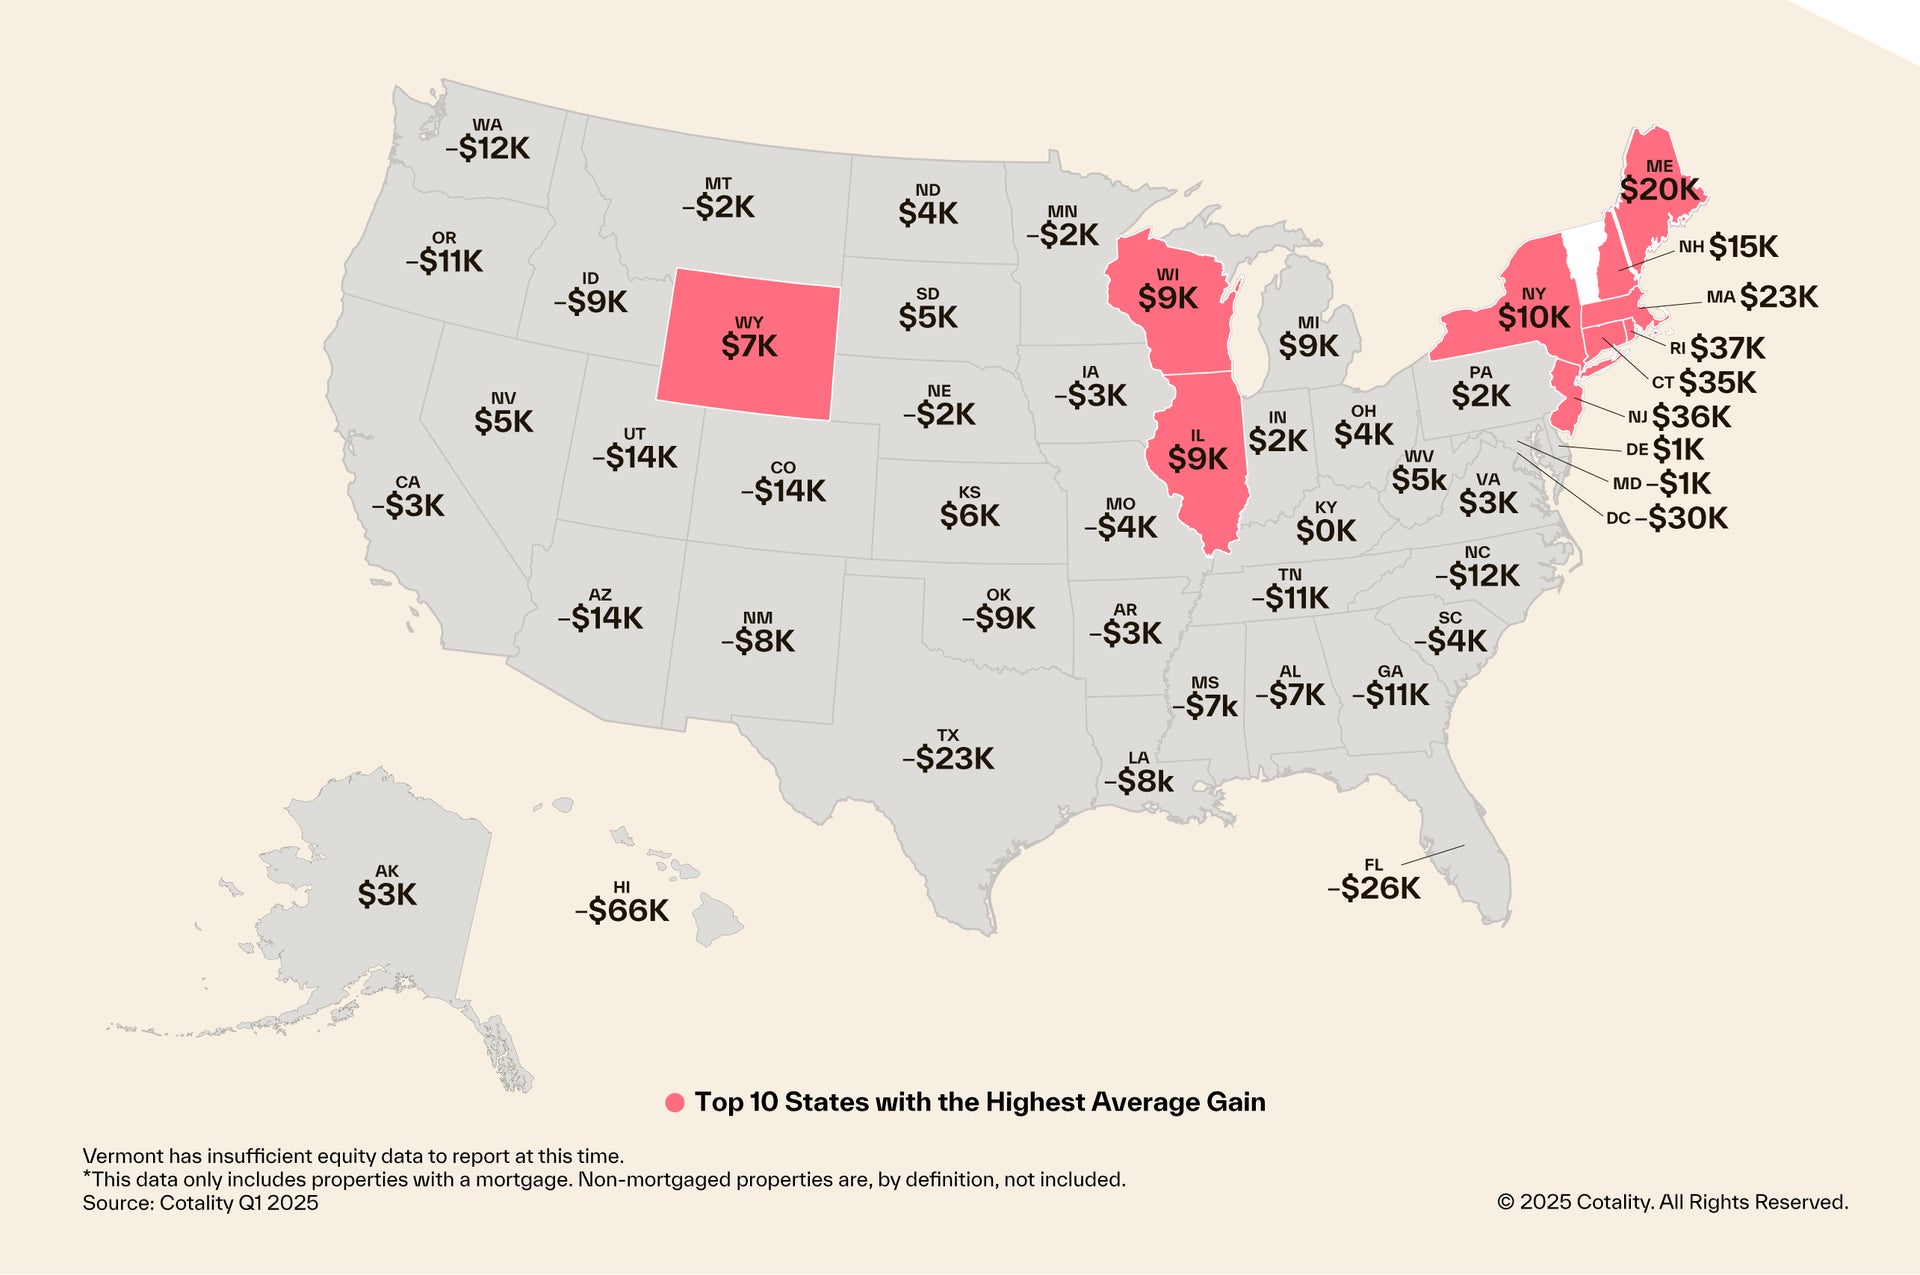
Figure 2: National home equity distribution by LTV segment
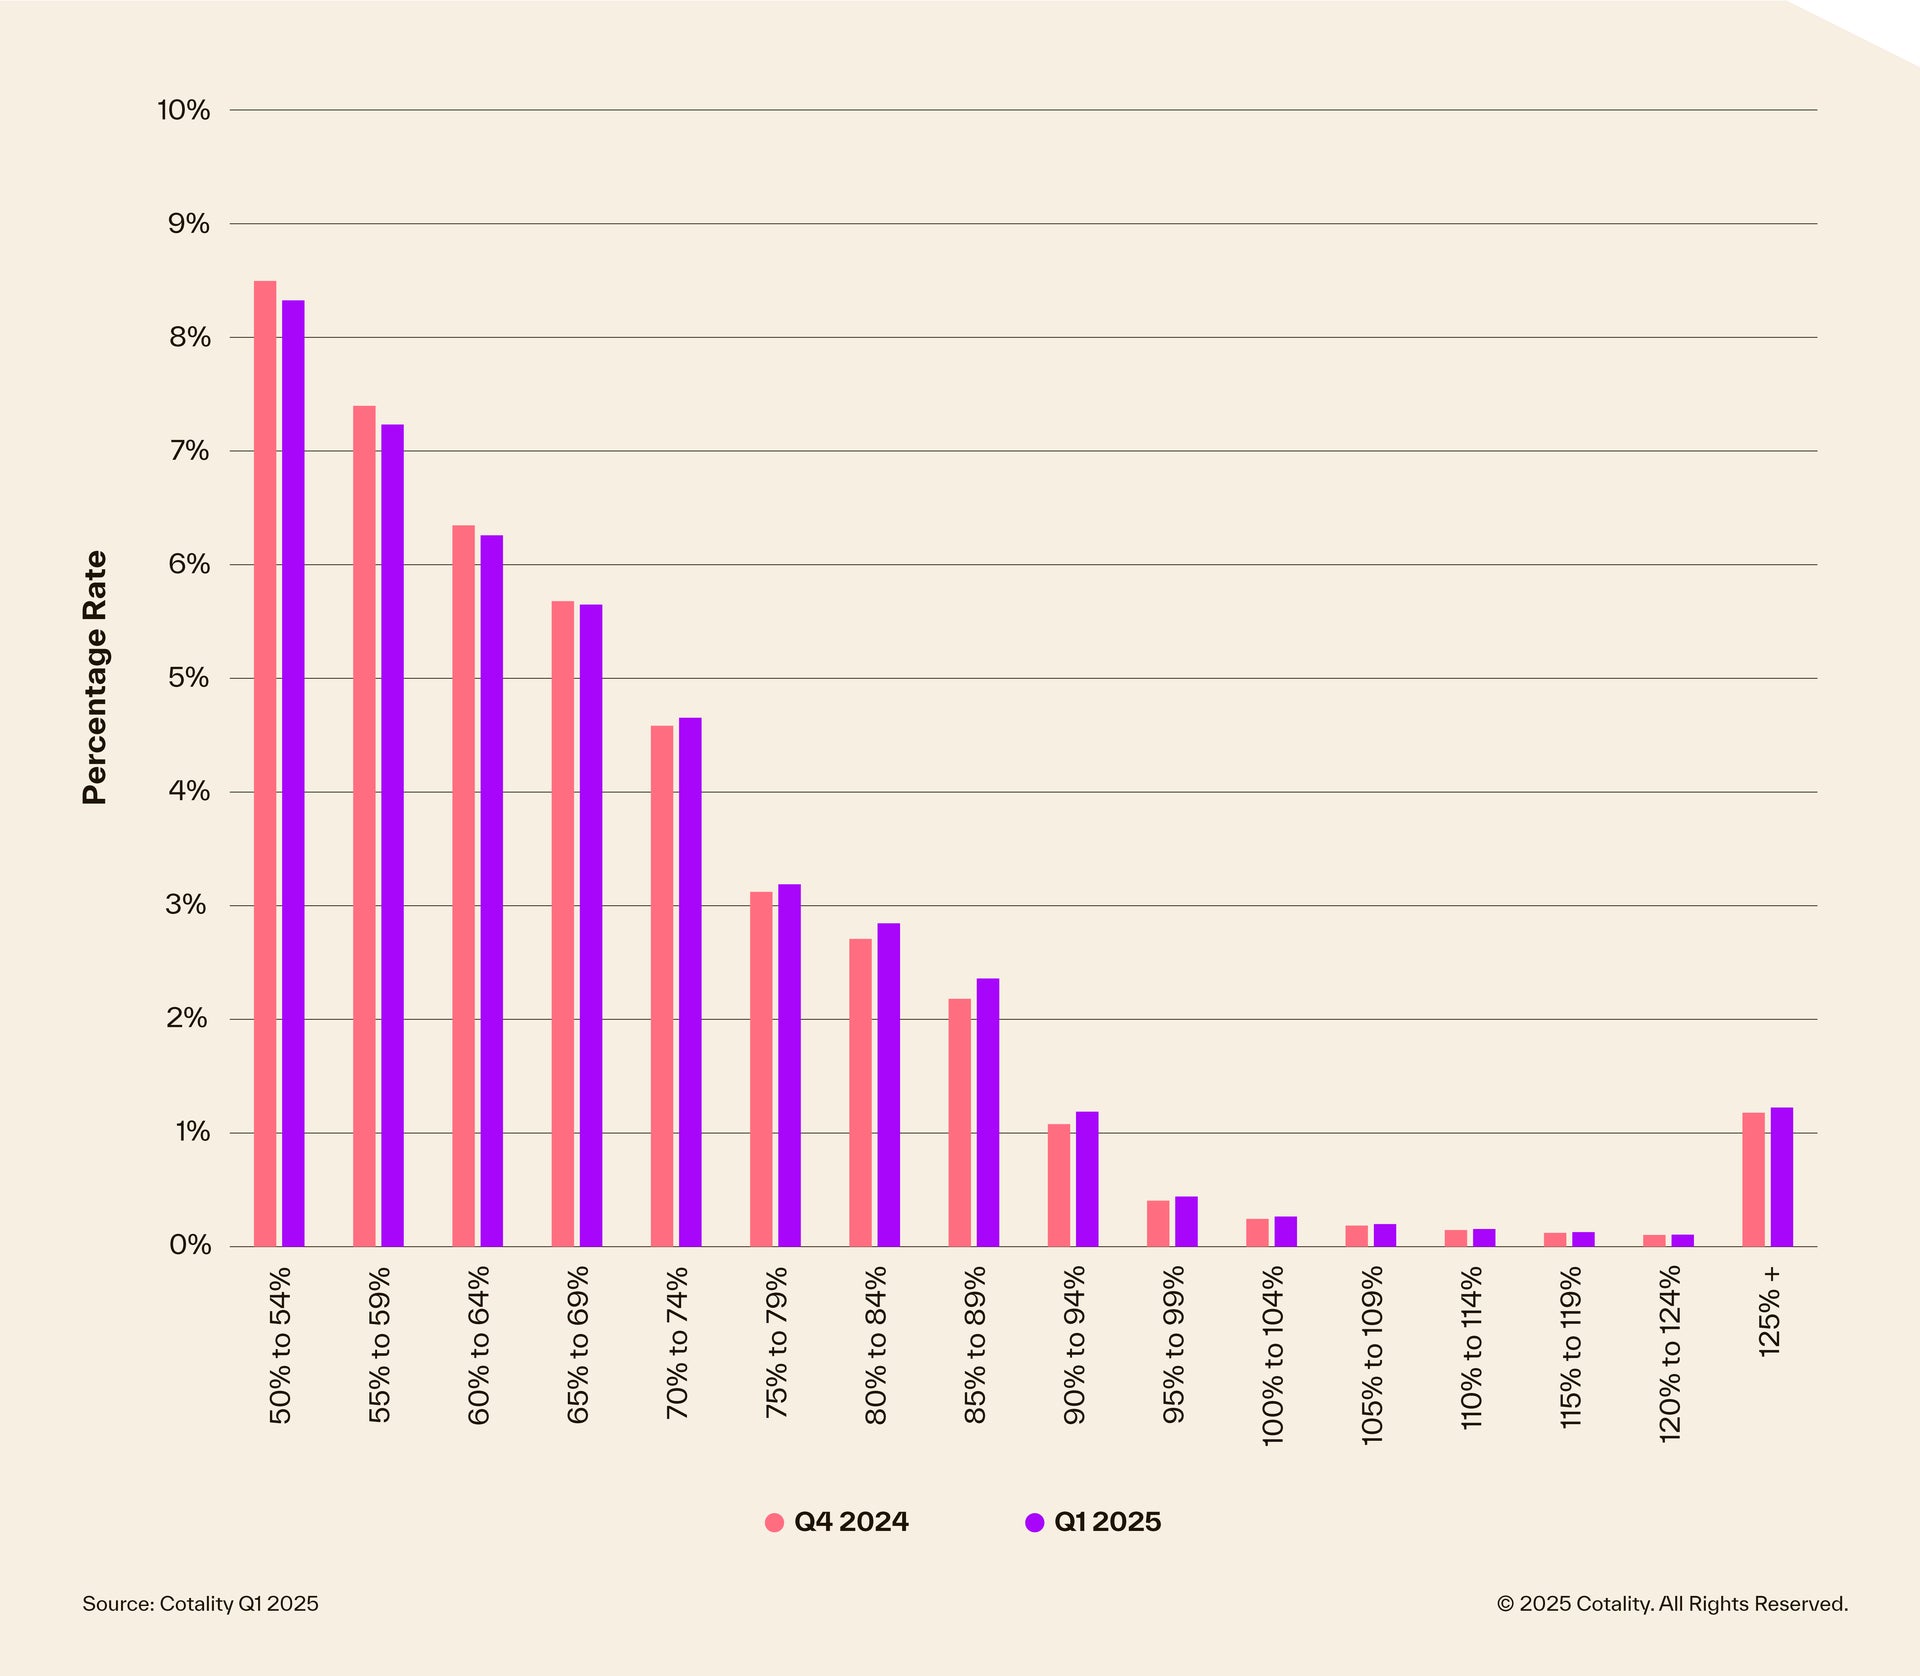
Table 1: Negative equity share for select metropolitain areas
Methodology
The amount of equity for each property is determined by comparing the estimated current value of the property against the mortgage debt outstanding (MDO). If the MDO is greater than the estimated value, then the property is determined to be in a negative equity position. If the estimated value is greater than the MDO, then the property is determined to be in a positive equity position. The data is first generated at the property level and aggregated to higher levels of geography. Cotality uses public record data as the source of the MDO, which includes more than 50 million first- and second mortgage liens and is adjusted for amortization and home equity utilization in order to capture the true level of MDO for each property. Only data for mortgaged residential properties that have a current estimated value are included. There are several states or jurisdictions where the public record, current value or mortgage data coverage is thin and have been excluded from the analysis. These instances account for fewer than 5% of the total U.S. population. The percentage of homeowners with a mortgage is from the 2019 American Community Survey. Data for the previous quarter was revised. Revisions with public records data are standard, and to ensure accuracy, Cotality incorporates the newly released public data to provide updated results.
Source: Cotality
The data provided is for use only by the primary recipient or the primary recipient’s publication or broadcast. This data may not be resold, republished, or licensed to any other source, including publications and sources owned by the primary recipient’s parent company, without prior written permission from Cotality. Any Cotality data used for publication or broadcast, in whole or in part, must be sourced as coming from Cotality, a data and analytics company. For use with broadcast or web content, the citation must directly accompany the first reference of the data. If the data is illustrated with maps, charts, graphs, or other visual elements, the Cotality logo must be included on screen or website. For questions, analysis, or interpretation of the data, contact newsmedia@cotality.com. Data provided may not be modified without the prior written permission of Cotality. Do not use the data in any unlawful manner.
About Cotality
Cotality accelerates data, insights, and workflows across the property ecosystem to enable industry professionals to surpass their ambitions and impact society. With billions of data signals across the life cycle of a property, we unearth hidden risks and transformative opportunities for agents, lenders, insurers, governments, and innovators. Get to know us at cotality.com.
Media Contact:
Charity Head
Cotality