Overview

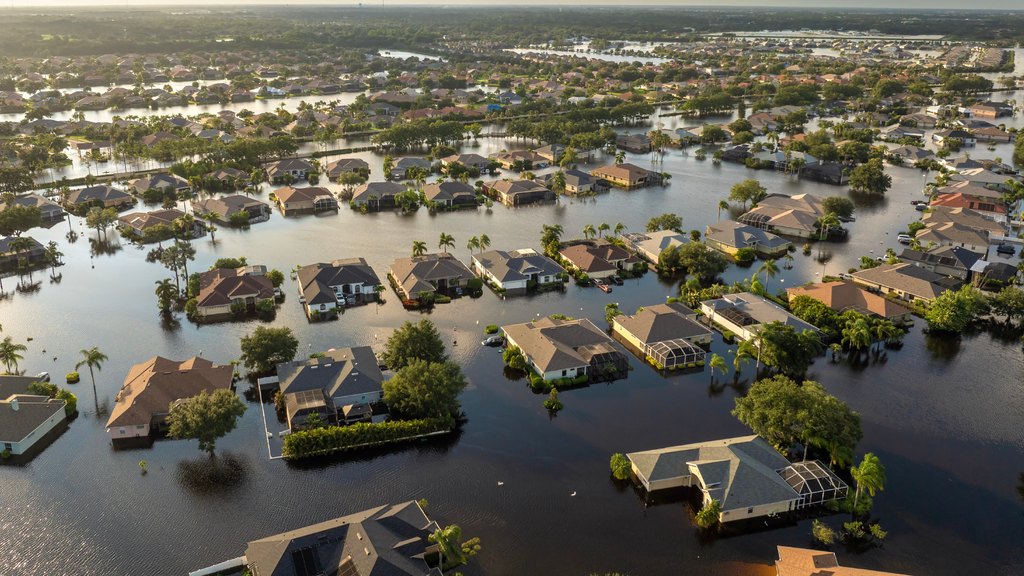
Slow-moving thunderstorms stalled across the Northeast and Mid-Atlantic on Monday, July 6, 2026, producing intense rainfall that triggered widespread flash flooding from New Jersey and New York into Connecticut and surrounding states.
The National Weather Service issued a series of flash flood warnings as rain rates climbed and small streams, storm drains, and urban roadways were quickly overwhelmed. By Tuesday, roughly 60 million people from Ohio eastward through Virginia and up to Massachusetts remained under some level of flood threat.
Rain rates reached about 2 inches per hour in the hardest hit locations, and some New Jersey communities recorded close to 6 inches of rain in a single day, an amount that in places met or exceeded what the state typically receives in the entire month of July.
New Jersey hit hardest
New Jersey saw the most severe impacts to people and property. Streets turned into fast-moving channels in Monmouth County, with flooding reported along Ocean Avenue in Deal and on Lake Street in Asbury Park.
Floodwaters entered homes and businesses in Camden, and in Ocean Township part of the roof of a wholesale club collapsed. Similar urban flooding and road closures were reported across the New York City suburbs. Critical infrastructure felt the strain throughout the corridor. Flooded roadways disrupted commutes and contributed to travel delays at major airports.
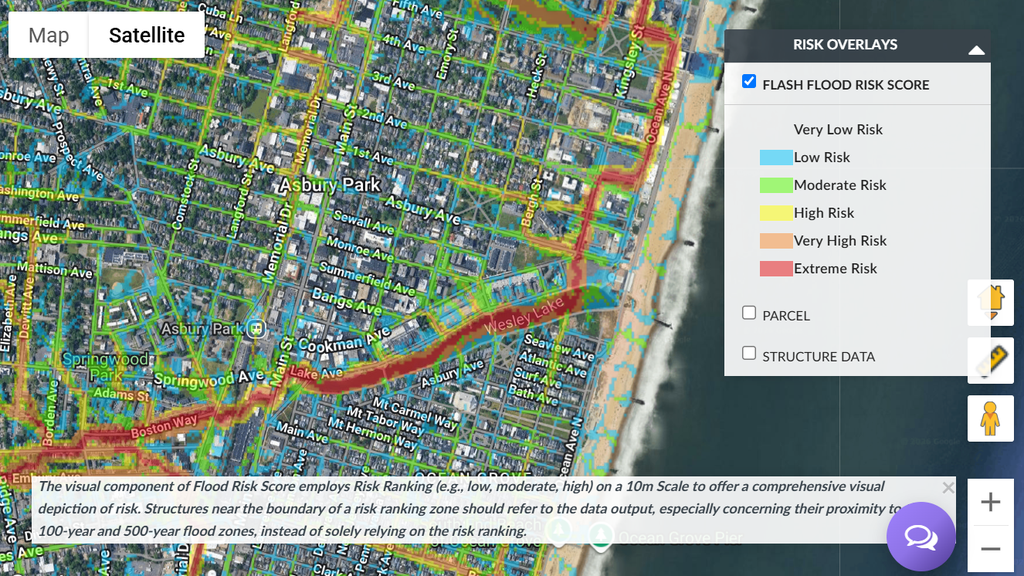
Figure 1: Map of Cotality Flash Flood Risk Score in Monmouth County, New Jersey
Data source: Cotality RiskMeter™, 2026
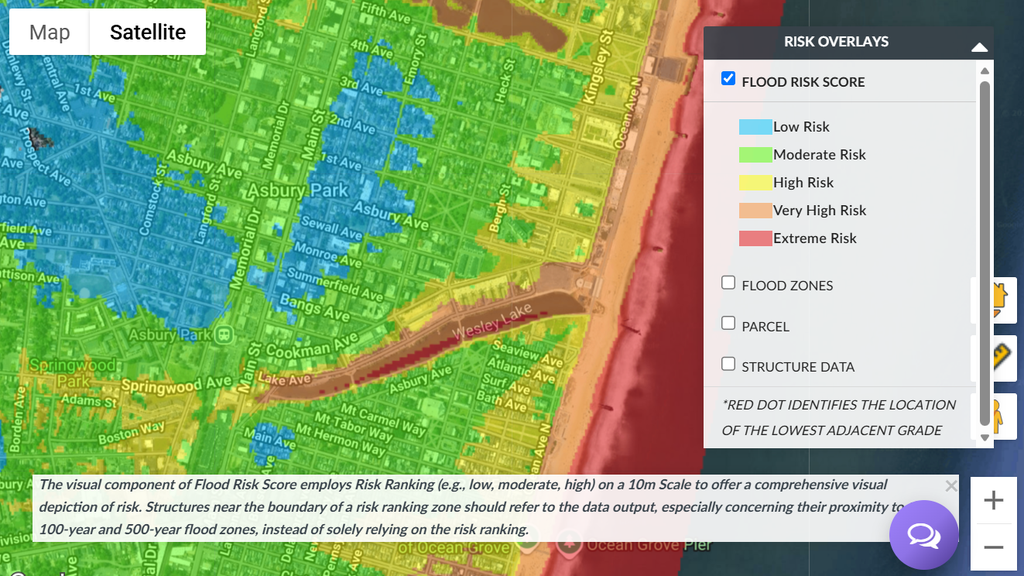
Figure 2: Map of Cotality Flood Risk Score in Monmouth County, New Jersey
Data source: Cotality RiskMeter™, 2026
Cotality Riskmeter™ data captured this exposure well before the storms arrived. As shown in the Flash Flood Risk Score map in Figure 1, the Lake Avenue corridor tracing Wesley Lake in Asbury Park registers at the top of the scale as Extreme Risk, the same low-lying stretch where some of the most severe street flooding was reported.
The companion Flood Risk Score map in Figure 2 shows a similar pattern, with parcels nearest the lake and the oceanfront falling into the Very High and Extreme categories while higher ground farther inland grades down to moderate and low risk. Resolved to a 10-meter scale, this alignment between where the water went and where the scores were already elevated illustrates how property-level risk data can flag the specific blocks most likely to flood, rather than treating an entire ZIP code or county as uniform.
What the flooding means for insurers
Much of the damage stems from inland flash flooding, an event that carries clear implications for insurers and reinsurers.
This kind of flash flooding is a peril that standard homeowners’ policies exclude and that is typically addressed through the National Flood Insurance Program or private flood products. High-intensity urban flooding of this kind highlights the growing exposure of densely developed areas where impervious surfaces speed up runoff.
“Events like this are a reminder that flood risk is not confined to the coastline or to mapped floodplains and highlight the growing protection gap. As intense flooding increases, consumers should consider safeguarding their property and financial security,” said Maiclaire Bolton Smith, VP of insurance market insights at Cotality. “For the insurance industry, high-intensity rainfall can drive significant losses, so it requires the same level of data and modeling as hurricanes.
For context, the Northeast has faced destructive flash flooding before, most notably in September 2021 when the remnants of Hurricane Ida produced record rainfall across New Jersey, New York, and neighboring states. While the July 6 storms were not tied to a tropical system, they reflect the same vulnerability to extreme short-duration rainfall.
Cotality will continue to monitor this event and may provide updates when available.